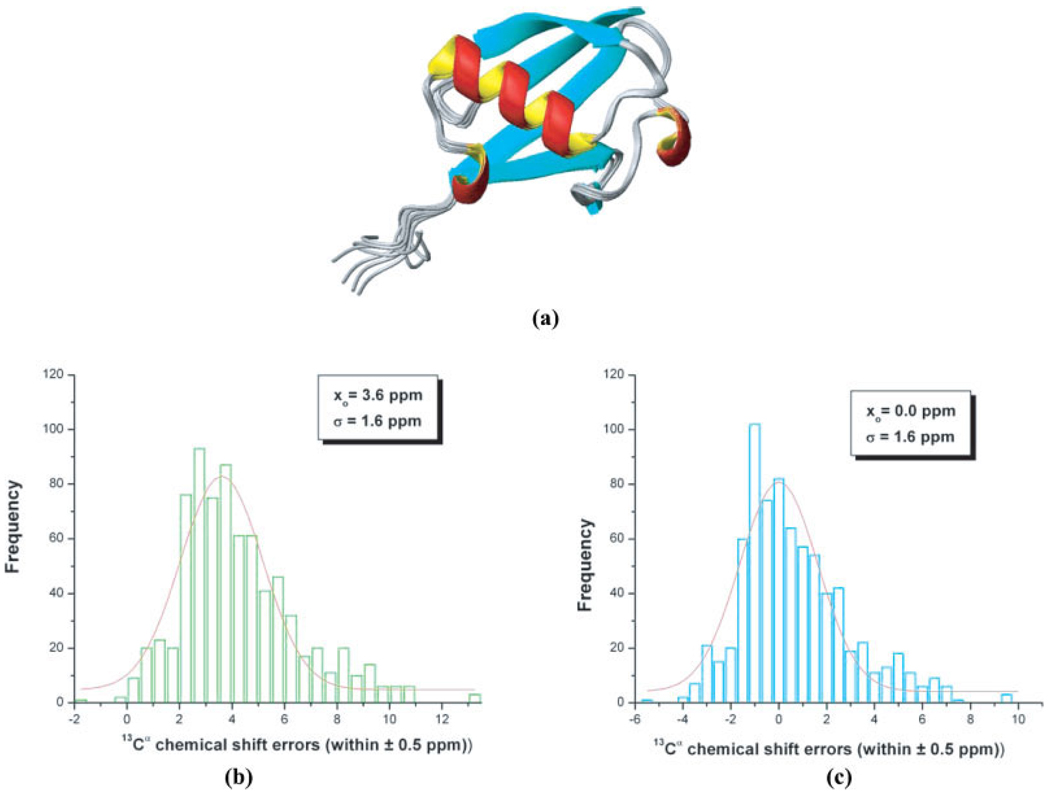
Figure 1.
(a) Ribbon diagram of the superposition of 10 NMR-derived conformations of the protein ubiquitin (PDB id: 1D3Z); (b) bars indicate the frequency of the error distribution, computed assuming a reference TMS value of 188.10 ppm, within a ±0.5 ppm interval between predicted and computed 13Cα chemical shifts (with the OB98 functional) from 10 conformations of ubiquitin (PDB code: 1D3Z) as explained in the Materials and Methods section. The distribution was generated by binning the data between −2 and 13 ppm. The solid red line represents the fitting of the data, only for the range of values provided, by a Gaussian (or Normal) distribution. The values of the mean, xo, and the standard deviation, σ, for the Gaussian (or Normal) distribution are inserted in the panel; (c) same as (b) but assuming an effective TMS value of 184.50 ppm, rather than 188.10 ppm used in (b).

