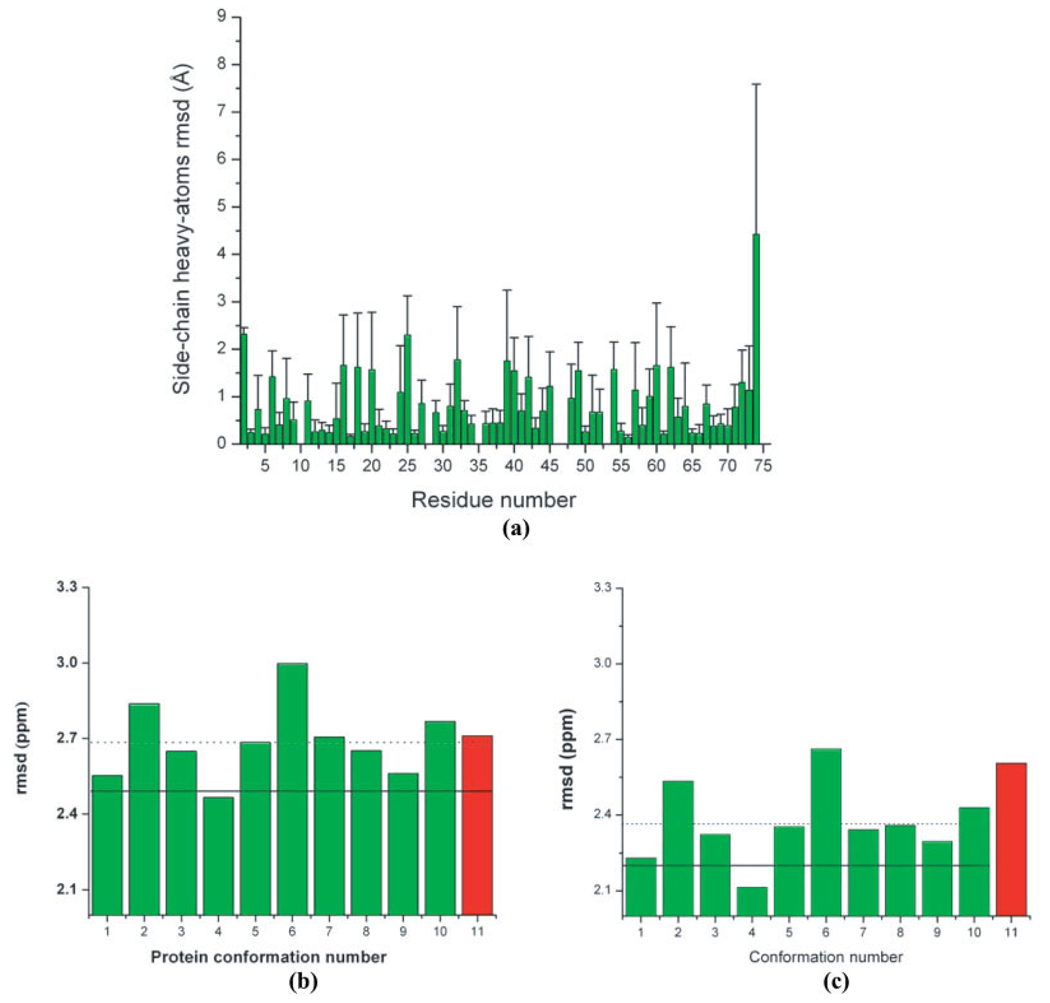
Figure 2.
(a) Bars indicate the per-residue all-heavy atoms side-chain rmsd (Å) between the 10 models of 1D3Z, i.e., by adopting model 1 as reference; (b) Green bars indicate the rmsd (ppm) between observed and computed 13Cα chemical shifts as described in the Materials and Methods section for each of the 10 conformations of ubiquitin (PDB code: 1D3Z). The red vertical bar indicates the rmsd (ppm) computed for the X-ray-derived structure of ubiquitin (PDB code: 1UBQ). The horizontal dotted line represents the mean value for the rmsd computed from the 10 NMR conformations of ubiquitin. The solid horizontal line indicates the ca-rmsd value computed from the 10 conformations of 1D3Z (as explained in the Materials and Methods section). All these results were obtained by using the B3LYP functional10; (c) as (b) but with the OB98 functional.

