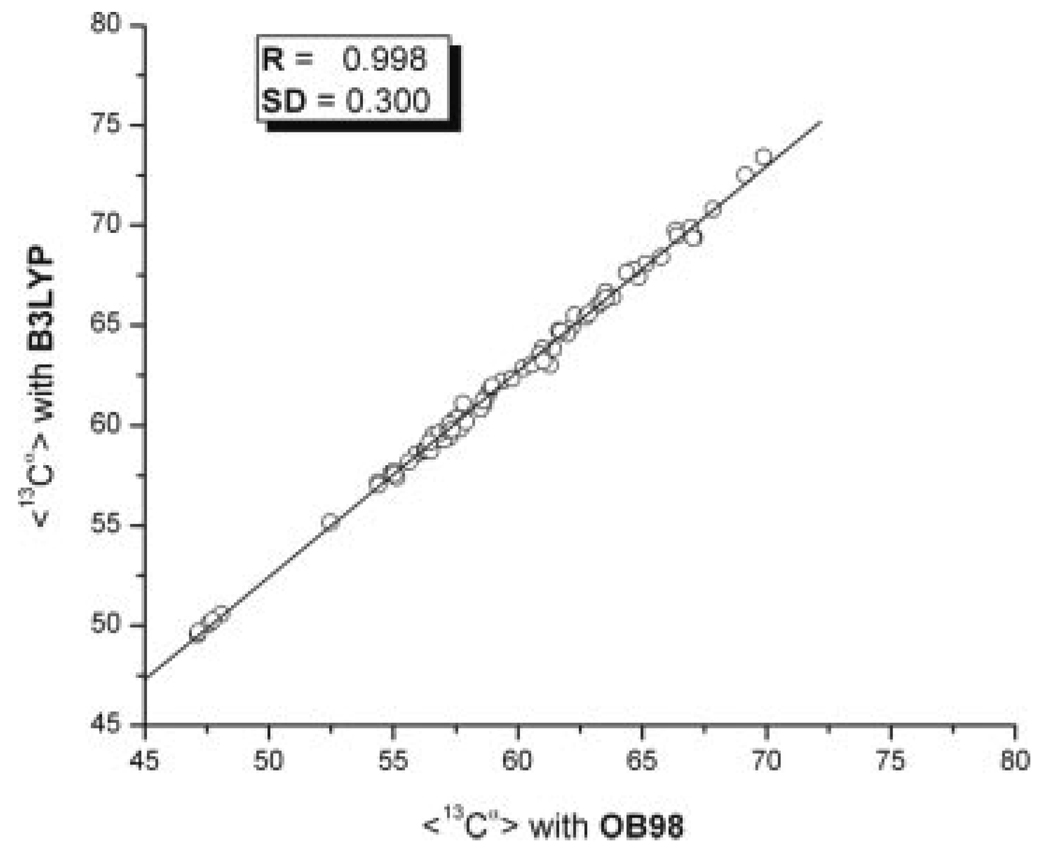
Figure 3.
Correlation between average, 〈13Cα〉, chemical shifts computed from the 10 conformations of ubiquitin (PDB code: 1D3Z) by using eq. (2) with B3LYP versus the same value computed with the OB98 functional. The line represents the linear regression. Values for the correlation coefficient (R) and the standard deviation from the linear regression SD are inserted in the panel.

