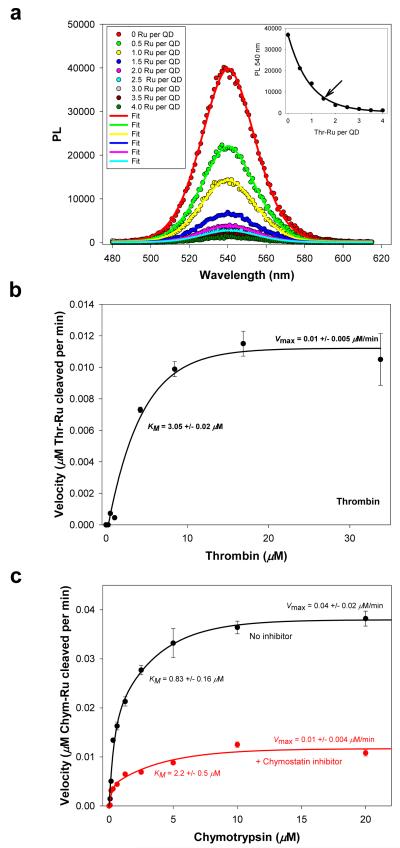
Figure 6. Proteolytic assay.
(a) Quenching of QDs following self-assembly with an increasing Thr-Ru-peptide-to-QD ratio; 540-nm emitting QDs were used. Gaussian fits of some of the PL spectra are also shown. Inset shows the PL at the peak value vs. Thr-Ru number, which served as a calibration curve. Arrow marks the ratio used as proteolytic substrate. (b) Velocity vs. thrombin concentration. (c) Velocity vs. chymotrypsin concentration in the absence and in the presence of a chymostatin inhibitor. The changes in kinetics parameters (higher KM and lower Vmax) are characteristic of a mixed inhibition process; data analysis within a mixed inhibition model provides a value for the inhibitor dissociation constant Ki of ~ 225 μM for Chymostatin37.

