Figure 1.
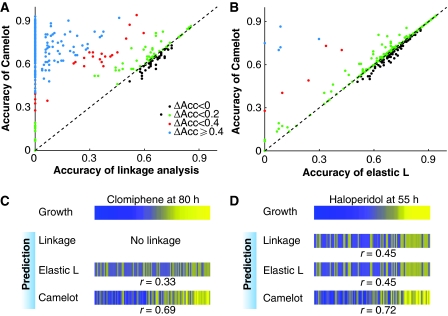
Camelot has superior predictive ability. Comparison of prediction methods on held out test data from different models. (A) Classification accuracy (see section Materials and methods): Camelot compared with linkage analysis. Each dot represents a condition (growth yield in the presence of a drug), showing the fraction correctly predicted by Camelot (y-axis) and linkage analysis (x-axis). Dots above the diagonal indicate the superior performance of Camelot and are colour coded to indicate the degree of improvement. (B) As in panel A, but the classification accuracy by Camelot is compared with that of the elastic-net L model lacking transcript features (see section Materials and methods). This demonstrates that for many conditions the inclusion of gene expression features improves Camelot's performance. (C) The top bar represents growth in the presence of clomiphene; each column is associated with a different segregant (matched horizontal positions within the panel) sorted by growth from low (blue) to high (yellow). The observed growth is compared with model prediction from linkage analysis, the elastic-net L model and Camelot. The bar marked elastic L represents predictions from bootstrapped elastic net regression using genotype alone, and the bottom bar represents prediction from Camelot. Prediction (on test data) improves from no detected linkage to most accurate for Camelot. The same scale is used for all the figures. (D) As in panel C, but for haloperidol.

