Figure 3.
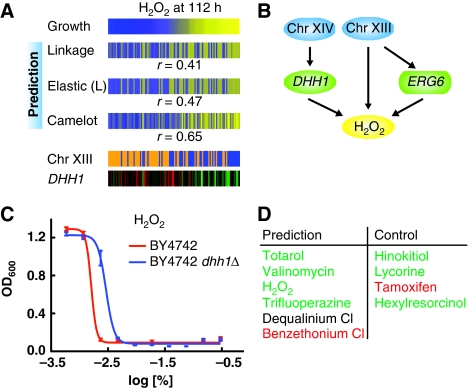
Causal role of DHH1. (A) Growth yield in the presence of H2O2 compared with model prediction from linkage analysis, elastic-net L model and Camelot, represented as in Figure 1C, demonstrating superior prediction by Camelot. Camelot chose a Chromosome XIII locus (227 254–243 624) and expression of DHH1 as features to predict the drug response; the values for each segregant are represented in the same order within the panel. (B) The full prediction function obtained from Camelot for response to H2O2. DHH1 is selected as a feature and confirmed by the triangle test; the Chromosome XIII marker is selected as a feature and the zoom-in score identifies ERG6 as the causal gene within the region, fitting with reports that overexpression of ERG6 leads to decreased resistance to hydrogen peroxide (Khoury et al, 2008). The Chromosome XIV locus is at position 449 639–486 861. Some notation for all the figures: Green rectangles (such as ERG6) represent expression of a gene within a linked region. (C) Averaged OD600 absorbance growth measurements of BY (red) and BY dhh1Δ mutant (blue) plotted against twofold dilution series of H2O2. The error bars represent the standard error of the mean for all growth yield data. These data confirm the causal effect of DHH1. (D) DHH1 is a hub passing the triangle test for six drugs (left column). Five of these were tested; validated causal effects are in green, with one false positive listed in red. To assess the drug specificity of DHH1-mediated effects, four negative controls were tested (right column); confirmed negative predictions are listed in green and one false negative in red. See Supplementary Figure 2 for drug response curves for each of the drugs tested, as represented in Figure 3C.

