Figure 4.
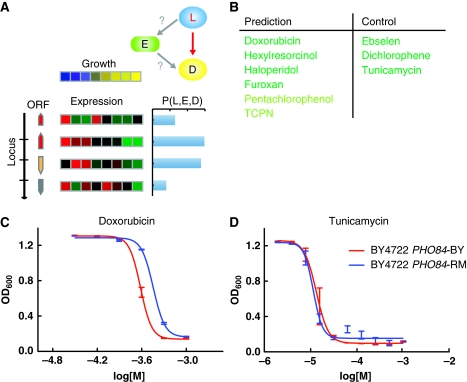
Causal role of PHO84. (A) The zoom-in score for each locus to drug association (red arrow) evaluates the likelihood, P(L, E, D), that each gene in the locus causally influences the growth of the strain in response to drug, based on its expression (each row represents a gene at the locus and each column a segregant; see section Materials and methods for details). (B) Validation of the ability of the zoom-in score to distinguish which drugs are influenced by PHO84. To the left are high-scoring drugs predicted to be influenced by PHO84; all six drugs were validated including two previously associated with PHO84 (Perlstein et al, 2007) (light green) and four new drugs associated with PHO84 (dark green). To the right are low-scoring drugs, not expected to be influenced by PHO84; PHO84 had no effect on the response for any of the three, validating the ability of the zoom-in score to make positive and negative predictions. (C) Averaged OD600 absorbance growth measurements of BY (red) and BY with an allele swap for PHO84-RM (blue) plotted against concentration of doxorubicin. See Supplementary Figure 3 for the response to each drug represented as in panel C. (D) As panel C, but for tunicamycin, showing that variation in the DNA sequence of PHO84 has little effect.

