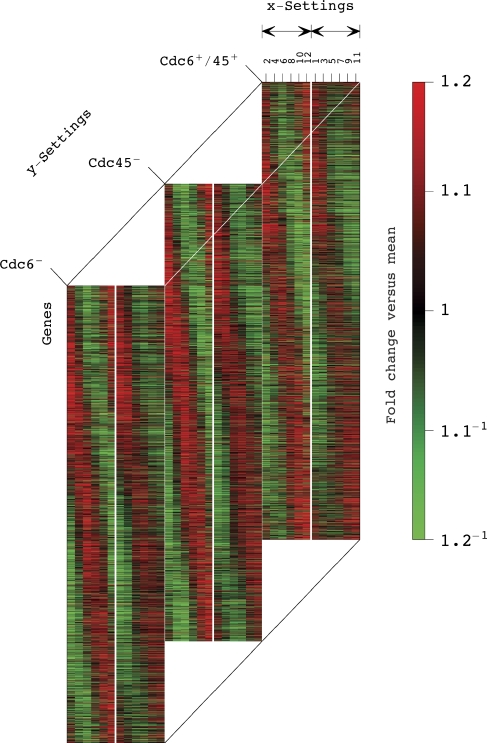
Figure 2.
The averaged data cuboid of mRNA expression of the 4270 genes across the 12 time points and across the three biological conditions (Supplementary information Dataset 3). Raster display with overexpression (red), no change in expression (black) and underexpression (green), where the expression of each gene is centered at its time-invariant level. The genes are sorted by their angular distances θ:=arctan(U:3/U:2) between the second and third HOSVD combinations (Supplementary information Section 2.6), which represent the unperturbed cell cycle expression oscillations (Box 1 and Supplementary Figure 12). The white lines separate the even and odd hybridization batches, indicated by black arrows. The picture of global expression oscillations in the averaged Cdc6+/45+ control time course is consistent with previous genome-wide mRNA expression analyses of synchronized Saccharomyces cerevisiae cultures (Alter et al, 2000; Alter and Golub, 2004; Alter, 2006; Li and Klevecz, 2006; Klevecz et al, 2008). The picture that emerges is that of unperturbed global expression oscillations that are dominant in the Cdc6−, Cdc45− as well as in the Cdc6+/45+ time courses.

