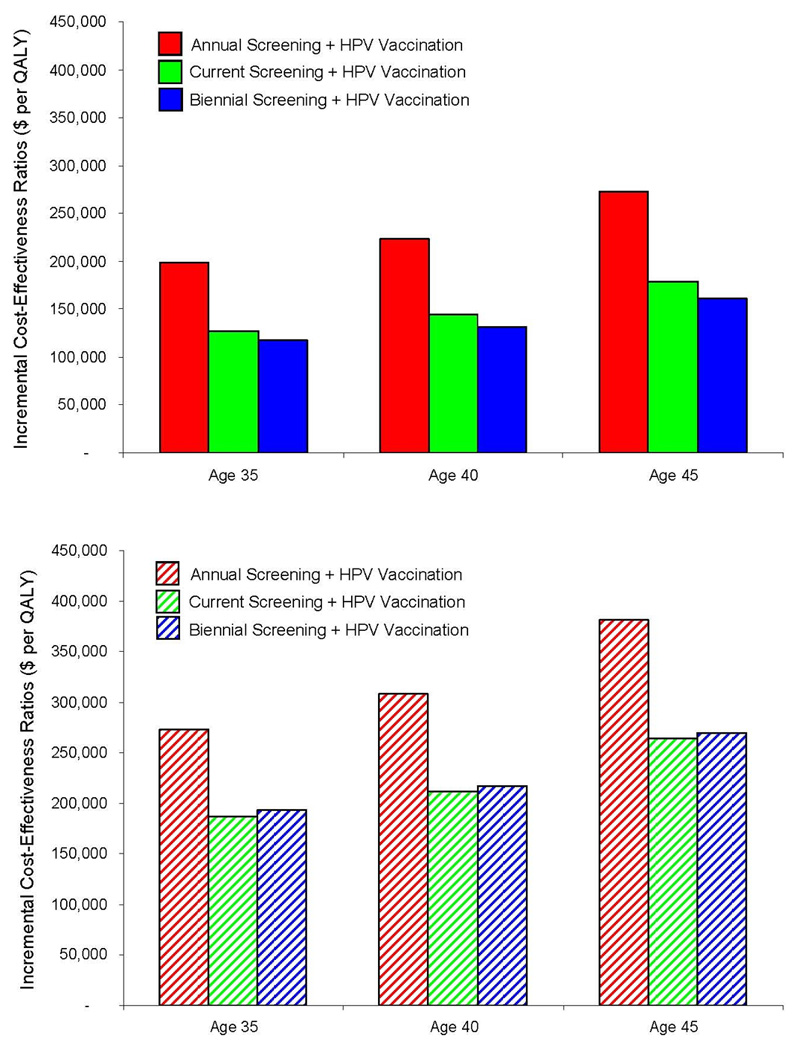
Figure 2. Cost-Effectiveness of HPV-16,-18 Vaccination of Screened Women and Specific Screening Algorithm.

Bars indicate the incremental cost-effectiveness ratios of adding HPV-16,-18 vaccination to cervical cancer screening for women who are 35, 40, and 45 years of age, when screening involves cytology with HPV DNA testing for triage of equivocal results, with no switch (top) and with a switch to combined cytology and HPV DNA testing after age 30 (bottom). Red represents the strategy of HPV vaccination in the context of annual screening; green, current screening; blue, biennial screening. Current screening assumes that among women who have ever been screened, 53% are screened annually, 17% every two years, 11% every three years, and 15% every five years (29–31). Ratios for each vaccination strategy are calculated compared to the corresponding screening strategy without vaccination; for example, HPV vaccination in the context of biennial screening for 40-year-old women is compared with biennial screening without vaccination for 40-year-old women. All ratios are expressed as cost per quality-adjusted life year ($ per QALY). All costs are expressed in 2006 U.S. dollars.
