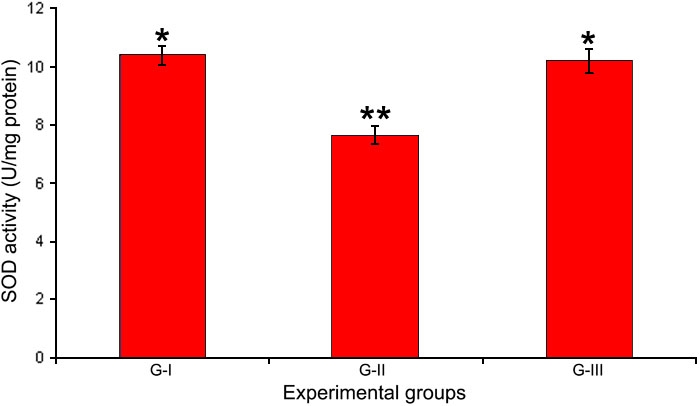
Figure 3.

Activity of SOD in lens. Activity of the antioxidant enzyme SOD in the lens of experimental groups. Values are expressed as mean (n=8) ±SD. Different symbols indicate statistically significant difference between groups at p<0.05 using one-way ANOVA. Groupings are G-I: Control, G-II: Selenite-supplemented, G-III: Selenite-supplemented + Drevogenin D treated.
