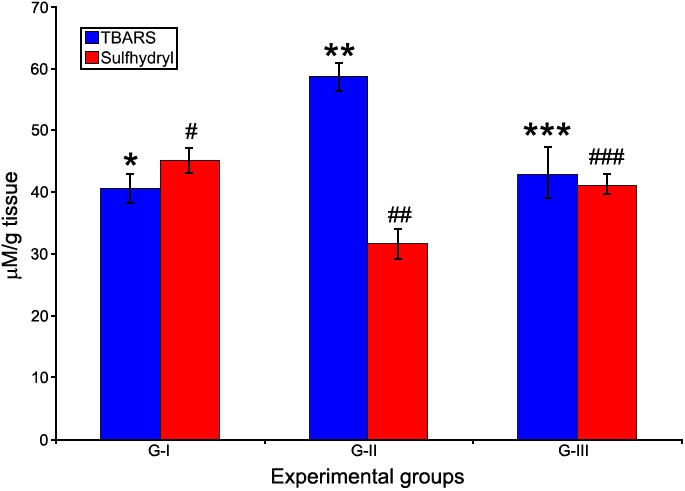
Figure 6.

TBARS and sulfhydryl content in lens. The levels of TBARS (a lipid peroxidation product index) and Sulfhydryl content (an index of protein oxidation) in lens. Values are expressed as mean (n=8) ±SD. Different symbols indicate statistically significant difference between groups of each parameter at p<0.05 using one-way ANOVA. Groupings are G-I: Control, G-II: Selenite-supplemented, G-III: Selenite-supplemented + Drevogenin D treated.
