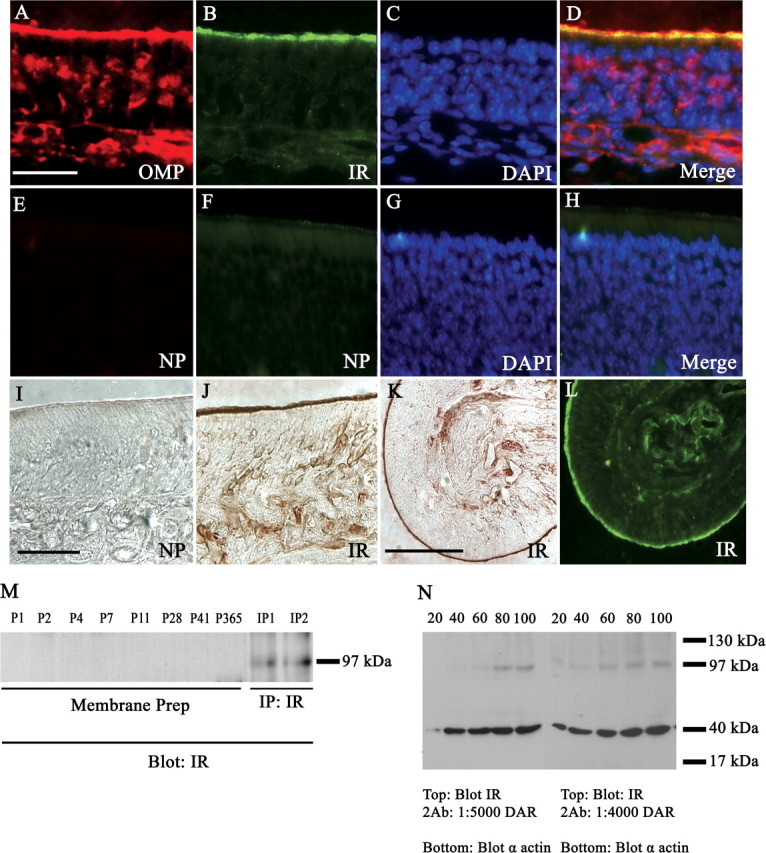
Figure 11.

IR expression in the olfactory epithelium. Same as in Figure 10, but for untreated mice double immunolabeled with α-OMP (A) and α-IR (B), and then stained with DAPI (C), and merged (D) to determine the distribution of IR in the epithelium. E–H, No primary controls (NP) demonstrating lack of immunoreactivity in the absence of αOMP or αIR primary antisera. I, J, Peroxidase-based immunolabeling: no primary control (NP) when IR antisera is omitted (I), αIR (J). K, L, Low field magnification of αIR labeling using peroxidase- and fluorescence-based detection on consecutive sections, respectively. Scale bars: A–J, 20 μm; K, L, 100 μm. M, Western blot analysis probing for αIR (Blot: IR) in purified MOE membranes (membrane prep) across various postnatal stages as indicated or in immunoprecipitates (IP: IR) prepared from P20 aged mice; 30 μg loaded protein; Mr = 97 kDa. N, Same as in M, but for whole-cell MOE lysates in which varying concentrations of loaded protein (indicated above gel) or donkey anti-rabbit secondary antisera (DAR) (below gel) were tested. Nitrocellulose membranes were cut at the 62 kDa migration marker, and the bottom one-half was probed with α-actin (blot α-actin) to verify successive increases in protein loading. Note: IR expression begins to resolve at 60 μg of loaded protein and displays very faint immunoreactivity at lower protein loading using higher secondary antisera concentrations.
