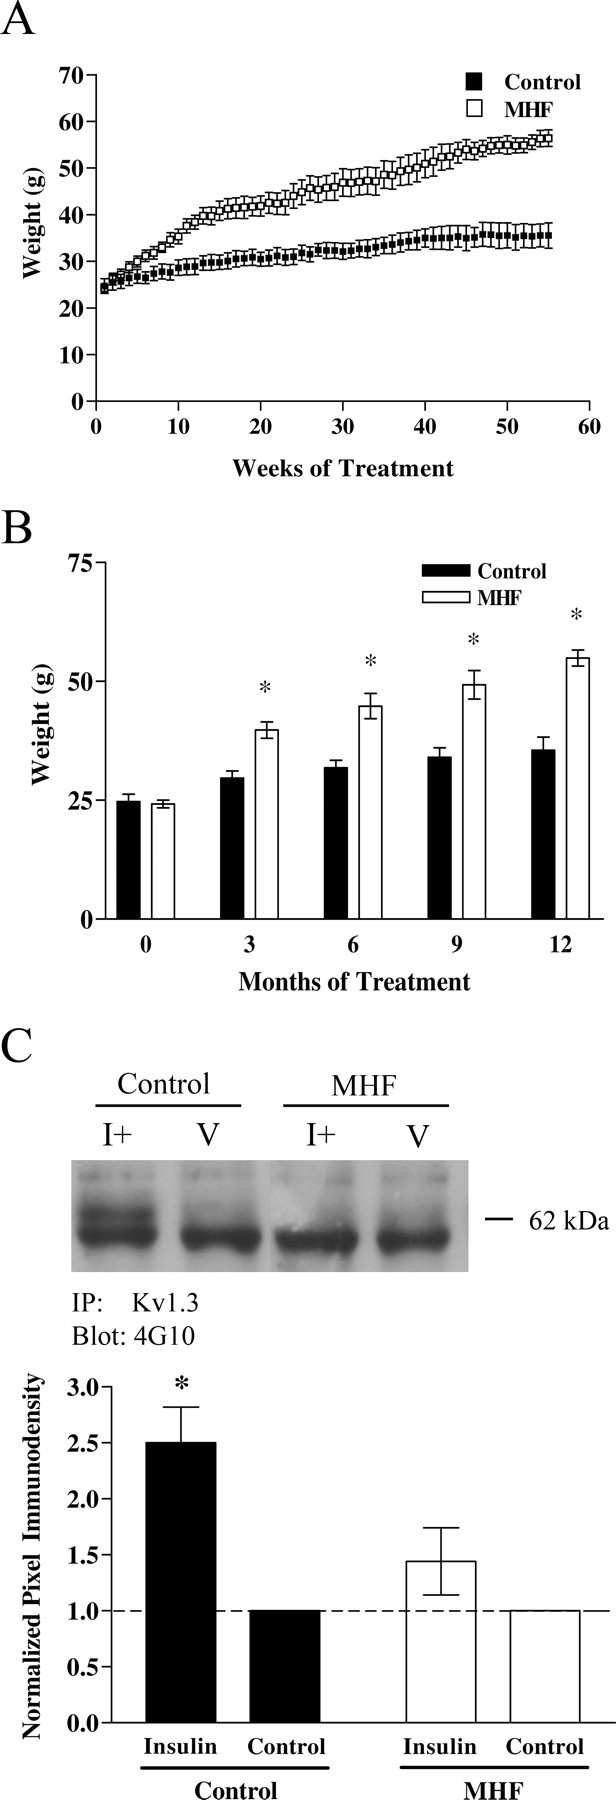
Figure 13.

Lack of insulin IND-induced Kv1.3 phosphorylation after maintenance on a MHF diet to yield a prediabetic state. A, B, Line (A) and bar graph (B) plotting the development of body weight gain in control (solid bars) versus MHF diet (open bars) maintained mice for a 55 week period. Data represent the mean (±SEM) of eight mice in each diet treatment group before IND treatment. *Significantly different mean, two-way ANOVA with a Student–Newman–Keuls test (α = 0.05). C, Representative Western blot and quantitative scanning densitometry summary bar graph of Kv1.3 tyrosine phosphorylation (62 kDa) in OB of control and MHF diet fed mice. The bottom band in all conditions is the heavy band of IgG. Analysis, IND treatment interval, and notation are as in Figure 1.
