
Figure 2.
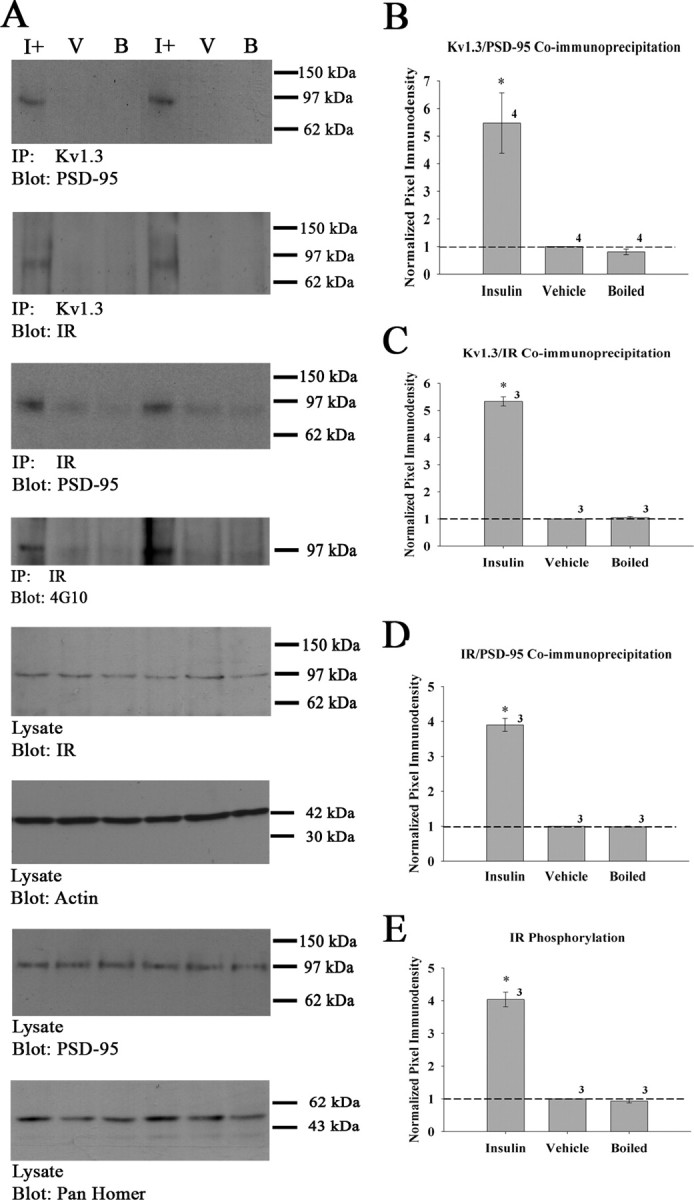
Insulin IND treatment enhances Kv1.3 protein–protein interactions with PSD-95 and IR. A, Representative Western blots and quantitative scanning densitometry summary histograms (B–E) of channel or kinase phosphorylation or coimmunoprecipitations as noted. Data represent awake IND delivery; protein biochemistry protocols, analysis, and applied statistics as in Figure 1. IR, Insulin receptor kinase. For each SDS-PAGE/Western blot example, two sets of awake IND treatment groups are shown to demonstrate accuracy and reproducibility across experiments. Labeling for actin in the input (lysate, blot: actin) is also demonstrated as an additional control. Sample sizes are as indicated.