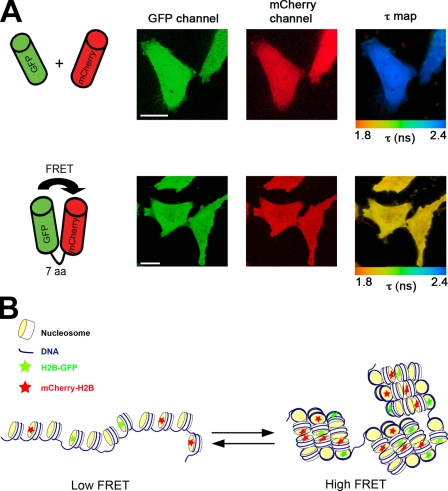
Figure 1.
In vivo FLIM–FRET assay for chromatin compaction. (A) HeLa cells coexpressing either free EGFP and mCherry (top) or EGFP-fused to mCherry through a 7-aa linker (bottom) were imaged by multiphoton laser-scanning microscopy (MPLSM). The spatial distribution of the mean fluorescence lifetime of the EGFP donor (τ map) is displayed using a continuous pseudocolor scale ranging from 1.8 to 2.4 ns. (B) Representation of the FLIM–FRET chromatin compaction assay. Bars, 10 µm.

