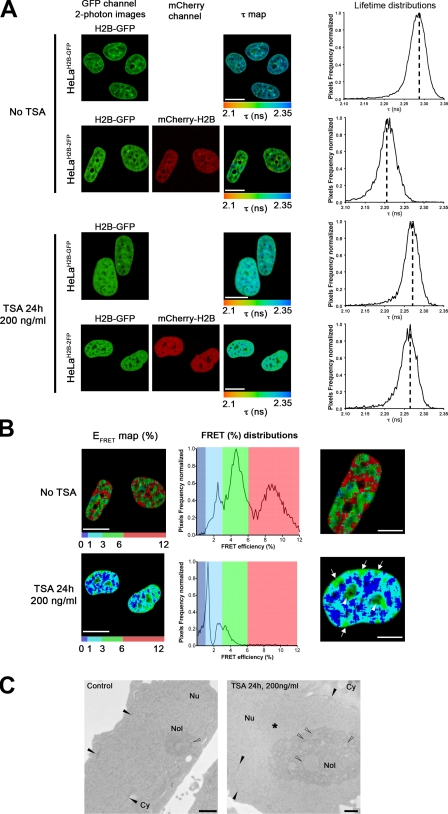
Figure 5.
FLIM–FRET analysis of TSA-induced changes in higher order chromatin organization. (A) The spatial distribution of the mean fluorescence lifetime (τ map) in the ROI is shown for both HeLaH2B-GFP and HeLaH2B-2FP stable cell lines before and after 24-h treatment with 200 ng/ml TSA. In each panel, the ROI comprised the interphase nuclei. Dashed lines mark the position of the peaks of the lifetime distribution curves. (B) EFRET map (percentage) of an ROI comprising two HeLaH2B-2FP nuclei before and after TSA treatment. The FRET distribution graphs are depicted using discrete colors, with the highest FRET population in red, intermediate population in green, and the lowest population in blue. Highest FRET values after TSA treatment are shown at nucleoli (arrowheads) and at the nuclear periphery (arrows). (C) TEM micrographs of HeLa cells before and after TSA treatment. Control untreated HeLa cells (left) and HeLa cells treated with 200 ng/ml TSA for 24 h (right) are shown. The heterochromatin at the nuclear periphery and associated to nucleoli are indicated by closed and open arrowheads, respectively. The asterisk represents bulk decondensed chromatin. Cy, cytoplasm; Nol, nucleolus; Nu, nucleus. Bars: (A and B) 10 µm; (C) 1 µm.

