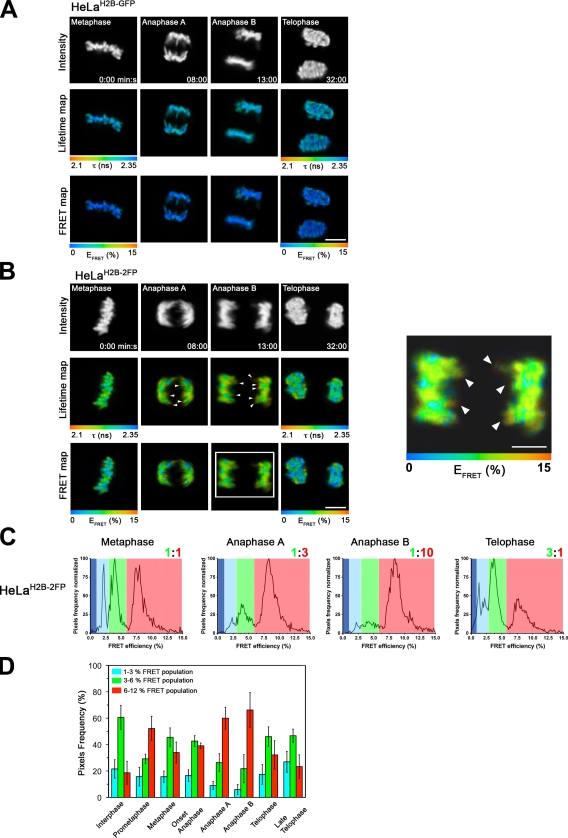
Figure 6.
FLIM–FRET analysis of chromosome compaction during mitosis. (A) Time-lapse FLIM–FRET measurements of HeLaH2B-GFP cells at different stages of mitosis. (top) Fluorescence intensity of the donor H2B-EGFP. The spatial map of the mean lifetime (middle) and the FRET percentage (bottom) are shown at the indicated stages of mitosis. At each stage of mitosis, the FRET percentage is depicted for a selected ROI (e.g., metaphasic equatorial plate in metaphase, the two separate paired chromosomes in early and late anaphase, or the two daughter nuclei at telophase). (B) Time-lapse FLIM–FRET of HeLaH2B-2FP cells during mitosis. (top) Fluorescence intensity of the donor H2B-EGFP. (middle) Fluorescence lifetime map. (bottom) FRET percentage map. At each stage of mitosis, the FRET percentage is depicted for a particular ROI (e.g., metaphasic equatorial plate in metaphase, the two separate paired chromosomes in early and late anaphase, or the two daughter nuclei at telophase). A higher magnification view of the FRET efficiency in anaphase B (boxed area) is shown in the right panel, with arrowheads indicating localized high FRET at the extremities of chromosome arms. (C) Quantification of the levels of FRET percentage efficiency populations during mitosis (see Materials and methods). A discrete color is associated to each distinct FRET population (low, blue; middle, green; high, red). The ratio between the medium and high FRET population is indicated. (D) Colored histogram showing the relative fraction of the three distinct FRET efficiency populations in interphase and at different stages of mitosis. Error bars indicate SD. Bars, 10 µm.

