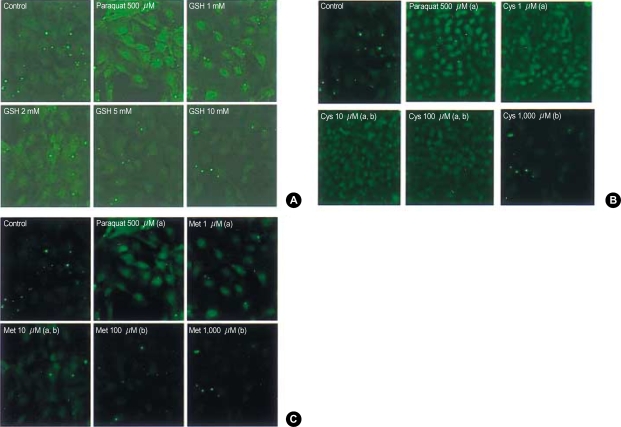
Fig. 1.
Effect of glutathione, cysteine and methinine on the production of ROS by paraquat in Swiss 3T3 fibroblasts. (A) 10 mM of GSH suppressed ROS in dose dependant pattern. Complete suppression of ROS was observed at 5 mM of GSH. (B) Cys at 1-1,000 µM suppressed the production of ROS in a dose-dependent manner. Software quantification of the signal intensities produced the following values: 2.50±0.31 in paraquat group, 2.25±0.22 in 1 µM Cys, 1.30±0.17 in 10 µM Cys, and 1.20±0.15 in 100 µM Cys. Complete suppression was observed at 1,000 µM Cys. (a) and (b) denote statistically significant differences in comparison with control (a) and (b) paraquat groups, respectively. (C) Met at 1-1,000 µM suppressed the production of ROS in a dose-dependent manner. Software quantification of the signal intensities produced the following values: 2.50±0.31 in paraquat group, 2.40±0.30 in 1 µM Met, 2.05±0.25 in 10 µM Met, 1.19±0.15 in 100 µM Met, and 1.05±0.12 in 1,000 µM Met. (a) and (b) denote statistically significant differences in comparison with control (a) and paraquat (b) groups, respectively.

