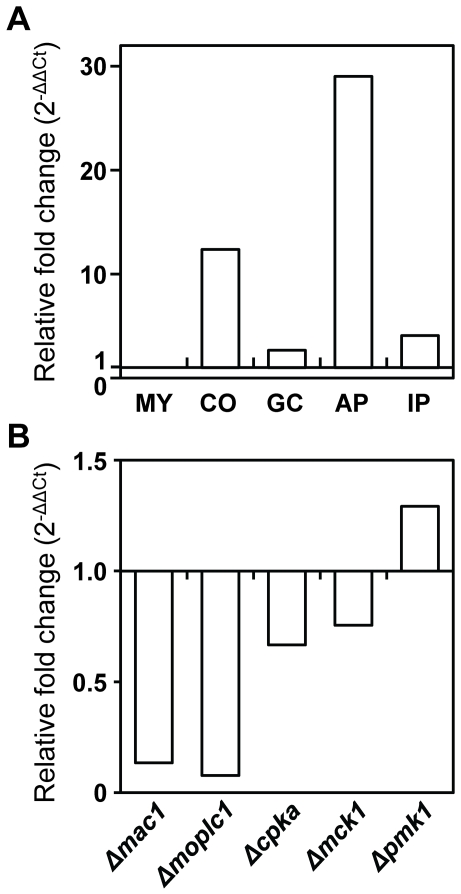
Figure 7. Expression patterns of MoHOX7.
(A) Expression of MoHOX7 during M. oryzae development. Abbreviations for the tissues used are shown in Figure 4A. The levels of MoHOX7 transcripts in a quantitative RT–PCR analysis were normalized to β-tubulin, and are expressed as relative values with 1 corresponding to the MY. (B) Expression of MoHOX7 in various deletion mutants. These include Δmac1, Δmoplc1, Δcpka1, Δmck1, and Δpmk1, and their genotypes were described in Table 1. The abundance of MoHOX7 transcripts in each mutant is expressed as a value relative to 1 in the wild-type KJ201.

