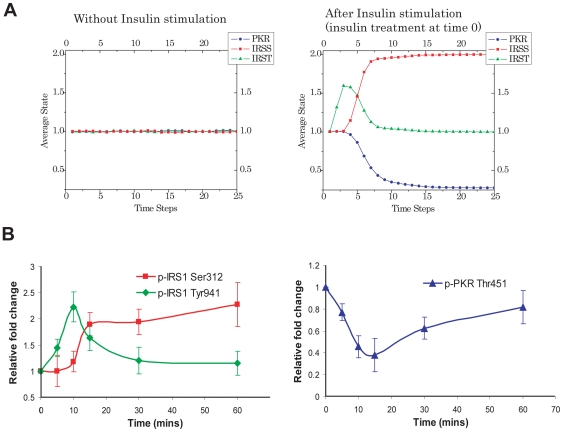
Figure 3. The simulated and experimental results of the PKR and IRS phosphorylation.
A) Model simulations with or without insulin stimulation. The simulation is on the initial model including the potential interactions and components from the literature and our experiments. The interactions emphasized are the level of IRS serine phosphorylation (IRSS), IRS tyrosine phosphorylation (IRST), and the PKR phosphorylation. B) Time series of the PKR and IRS phosphorylation upon insulin stimulation at time 0. HepG2 cells were exposed to 1 nM of insulin for 5, 10, 15, 30, or 60 minutes. After treatment, the cells were harvested, and western blot analysis was performed to detect the total and phosphorylated levels of PKR and IRS1 [3]. The phosphorylation levels of PKR (blue) and IRS1 (red for p-IRS1 at Ser312 and green for p-IRS1 at Tyr941) were quantified and normalized to the total protein levels of PKR and IRS1, respectively, and are expressed as the average of four samples±SD from four independent experiments.

