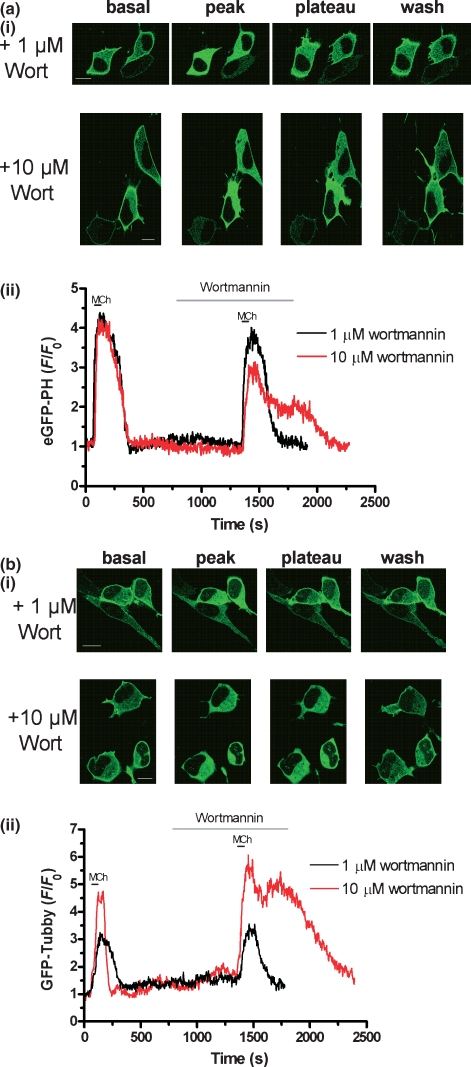
Fig. 3.
The effect of PI4-kinase inhibition on translocation of GFP-labelled biosensors in response to MCh in SH-SY5Y cells. Representative images (i) and traces (ii) of eGFP-PH (a) and GFP-Tubby (b) translocation in response to MCh (1 mM; black horizontal bar) in cells in the presence of pre-incubated 1 μM (black trace) or 10 μM (red trace) wortmannin (as indicated by grey horizontal bar). Data were expressed as a ratio change in cytosolic fluorescence emission (F) relative to the initial basal fluorescence (F0) and are representative of at least eight cells from three or more coverslips. Scale bars, 10 μm.

