Fig. 4.
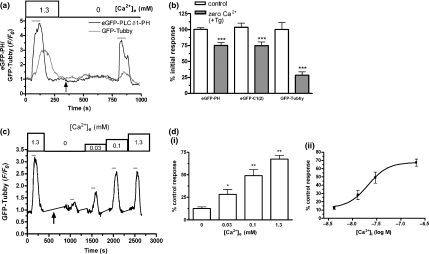
Determining the Ca2+-sensitivity of PLC activity using GFP-labelled biosensors. (a) Representative traces demonstrating eGFP-PH (black line) and GFP-Tubby (grey line) responses to MCh (100 μM; grey horizontal bars) in SH-SY5Y cells in Krebs–Henseleit buffer (KHB) containing 1.3 mM Ca2+, and under Ca2+-free (0 Ca2+) conditions and addition of thapsigargin (5 μM; black arrow) to deplete intracellular Ca2+ stores. Data were expressed as a ratio change in cytosolic fluorescence emission (F) relative to the initial basal fluorescence (F0). (b) Cumulative data representing eGFP-PH, GFP-Tubby and eGFP-C1(2) translocation in response to MCh (100 μM) in KHB containing 1.3 mM Ca2+ (control) and in nominally Ca2+-free following the addition of thapsigargin (5 μM) (0 Ca2+ + Tg). Data were presented as a mean percent of an initial control response achieved in the presence of 1.3 mM Ca2+. Differences between control and Ca2+-free responses were determined by one way anova and Bonferroni’s post hoc test (***p<0.001). (c) Representative trace illustrating GFP-Tubby responses to MCh (100 μM; grey horizontal bars) in SH-SY5Y cells in KHB containing 1.3 mM Ca2+ and in 0 (nominally Ca2+-free), 0.03, 0.1 or 1.3 mM Ca2+ following addition of thapsigargin (5 μM; black arrow). Data were expressed as a ratio change in cytosolic fluorescence emission (F) relative to the initial basal fluorescence (F0). [d(i)] Cumulative data representing GFP-Tubby translocation in SH-SY5Y cells following thapsigargin (5 μM) treatment in nominally free extracellular Ca2+ and subsequent stimulation with MCh (100 μM) in the presence of KHB containing 0, 0.03, 0.1 and 1.3 mM Ca2+. Responses were normalized to the initial control response achieved in 1.3 mM Ca2+ prior to thapsigargin treatment and are expressed as mean percent of control response. Differences between responses in nominally Ca2+-free KHB (0 Ca2+) and those in the presence of increasing concentrations of extracellular Ca2+ were determined by one-way anova and Dunnett’s post hoc test (*p<0.05; **p<0.01). [d(ii)] Concentration–response curve representing GFP-Tubby responses to MCh (100 μM) as a function of the intracellular Ca2+ concentration (determined from Fluo-4 emissions) after thapsigargin (5 μM) treatment and the establishment of a steady state level of [Ca2+]i. Responses were normalized to the initial control response achieved in 1.3 mM Ca2+ prior to thapsigargin treatment and are expressed as mean percent of this control response. Where appropriate, data were expressed as mean ± SEM for four or more cells from at least three separate coverslips.

