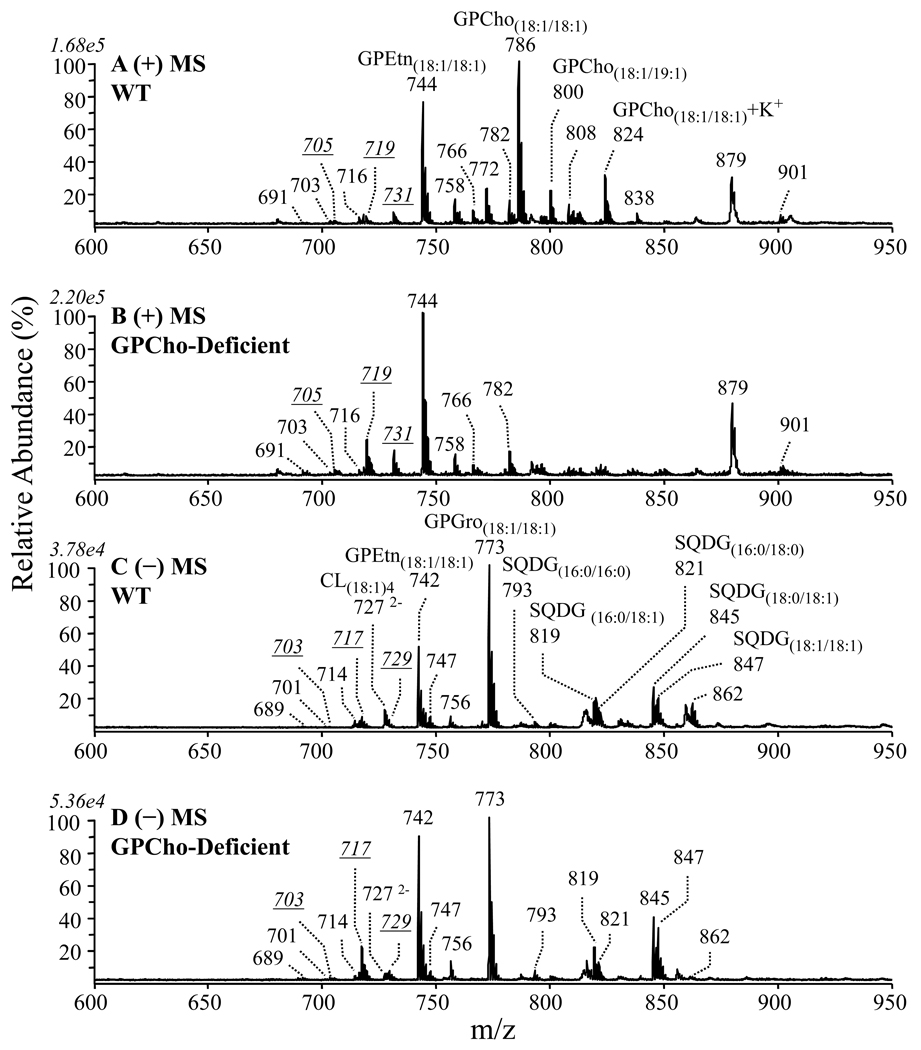
Figure 1.
Positive ion ESI MS of crude lipid extracts isolated from the cell membranes of (A) wild type and (B) GPCho-deficient mutant R. sphaeroides (both with CcO over-expression). The negative ion ESI MS spectra are shown in panels (C) and (D), respectively. Only those ions within the selected m/z range of interest (600 – 950) are displayed. The italic underlined numbers represent ions of interest to this study.

