
Fig. 3.
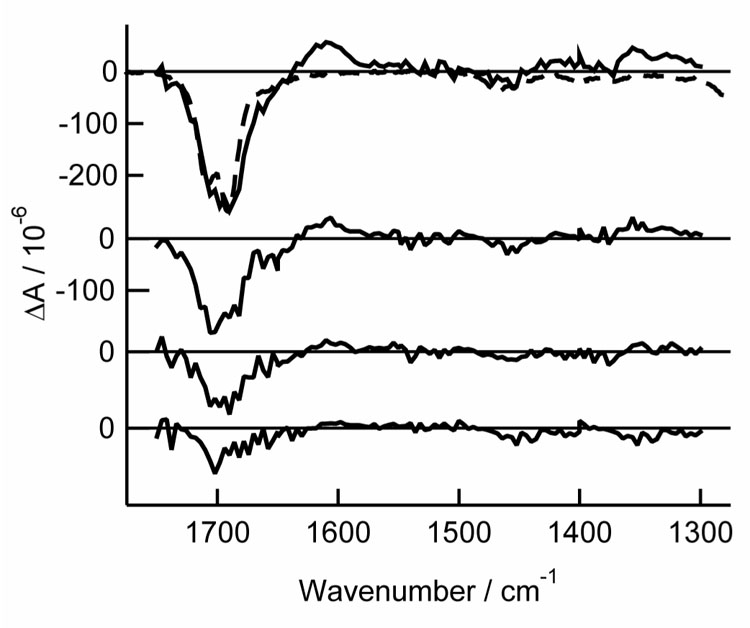
TRIR spectra of thymidine in argon-purged acetonitrile-d3 at delays of, from top to bottom: 0 – 1 µs, 1 – 2 µs, 2 – 3 µs, and 3 – 4.5 µs. Also shown is the inverted and scaled steady state spectrum (dashed line).
Official websites use .gov
A
.gov website belongs to an official
government organization in the United States.
Secure .gov websites use HTTPS
A lock (
) or https:// means you've safely
connected to the .gov website. Share sensitive
information only on official, secure websites.
TRIR spectra of thymidine in argon-purged acetonitrile-d3 at delays of, from top to bottom: 0 – 1 µs, 1 – 2 µs, 2 – 3 µs, and 3 – 4.5 µs. Also shown is the inverted and scaled steady state spectrum (dashed line).