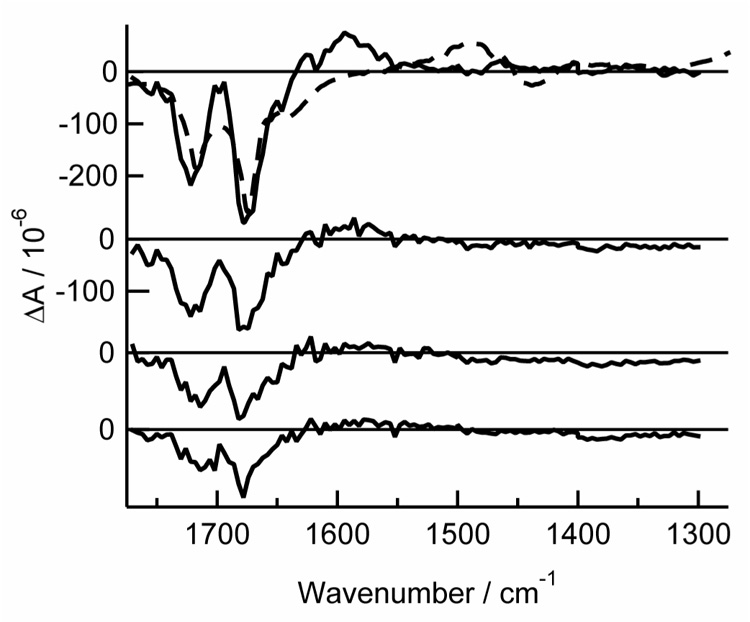
Fig. 4.

TRIR spectra of thymine-d2 in argon-purged acetonitrile-d3 at delays of (from top to bottom): 0 – 1 µs, 1 – 2 µs, 2 – 3 µs, and 3 – 4.5 µs. Also shown is the inverted, scaled FTIR spectrum (dashed line). The positive feature in the FTIR spectrum at ~1500 cm−1 is an artifact of baseline subtraction.
