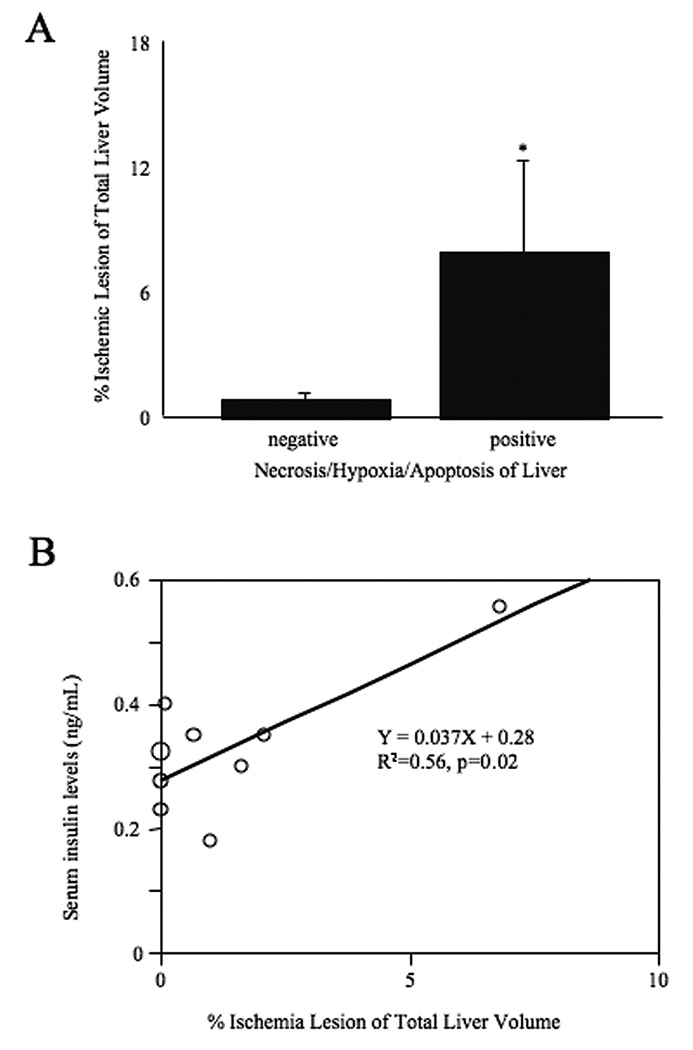
Figure 5.
A. Comparison ischemic lesion of liver ischemic volume (indicated as hyperintensity area in T2WI) with and without histological findings (necrosis / ischemia / apoptosis). The group with positive histological findings at POD 2 was significantly higher than negative group at POD 0 and POD 28). Statistical assessment was performed by Student t test. Significance indicated as *, p<0.05. B. Correlation between ischemic lesion and serum insulin levels. Data revealed that serum insulin levels significantly correlated with ischemic lesion (R2 = 0.56, p = 0.02). Statistical analysis was performed by simple regression analysis.

