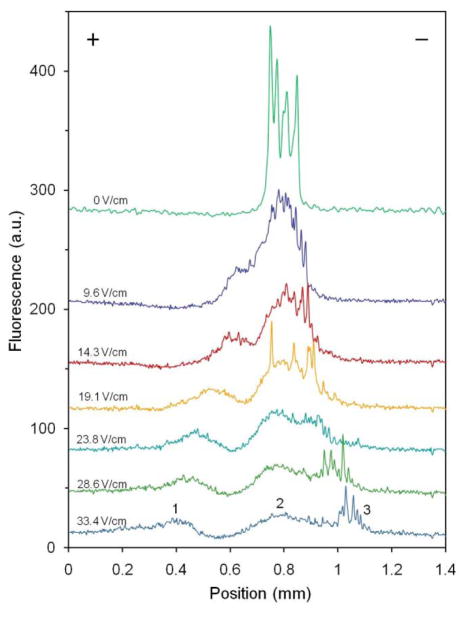
Figure 4.
Profiles of mitochondria μFFE separations at different electric field strengths. Linescans were produced by averaging 60 consecutive, background corrected images. Intensity of linescans taken at 0 V/cm was divided by factor of 2 to fit into the graph. Conditions are the same as in Figure 2.

