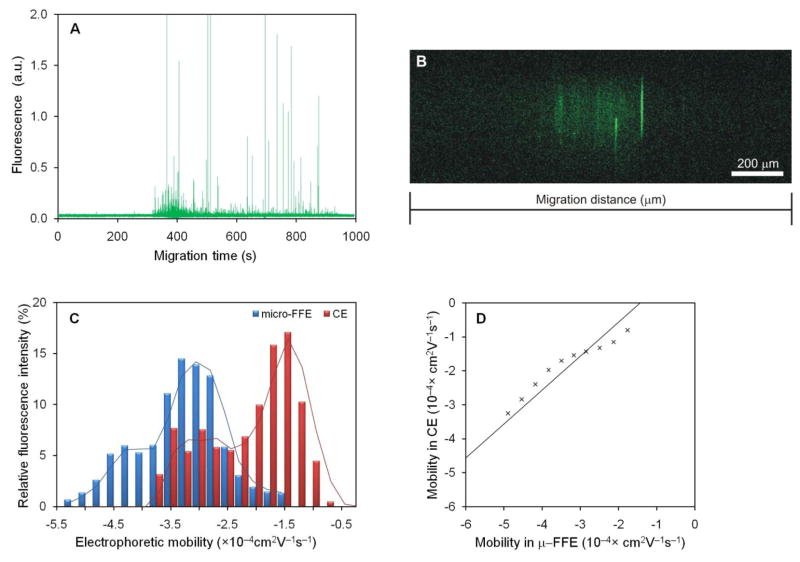
Figure 6.
Comparison of mitochondria mobility distributions measured using μFFE and CE-LIF. Mitochondria were separated by CE-LIF at 360 V/cm (A) and using μFFE at 14.3 V/cm (B). The lateral position in μFFE and the migration time of each event in CE were used to calculate electrophoretic mobilities. Data were corrected for EOF using fluorescein as an internal standard and segmented into 0.25×10⁻⁴ cm2V−1s−1 wide bins and plotted as a histogram (C). In CE, fluorescence intensity was normalized to the total fluorescence intensity of all detected peaks. The mitochondrial mobility distributions measured using μFFE and CE-LIF were compared using a q–q plot (D).

