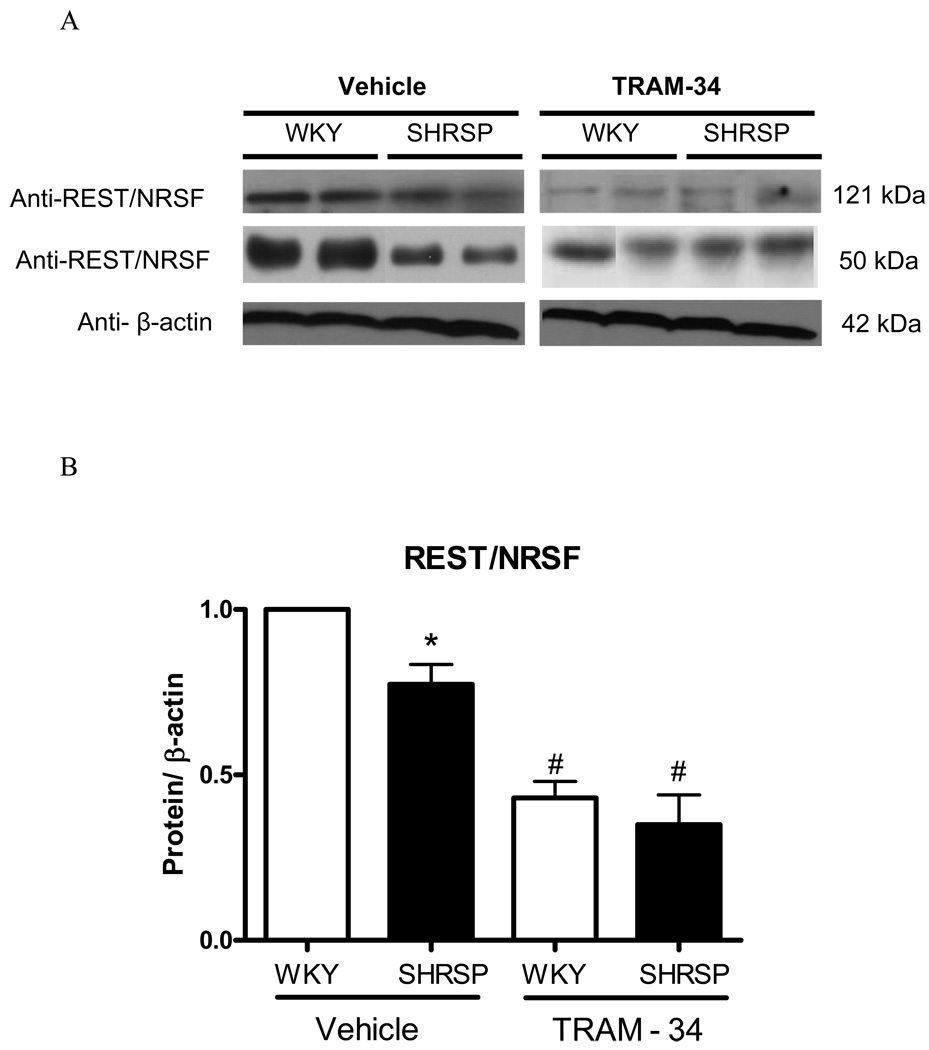
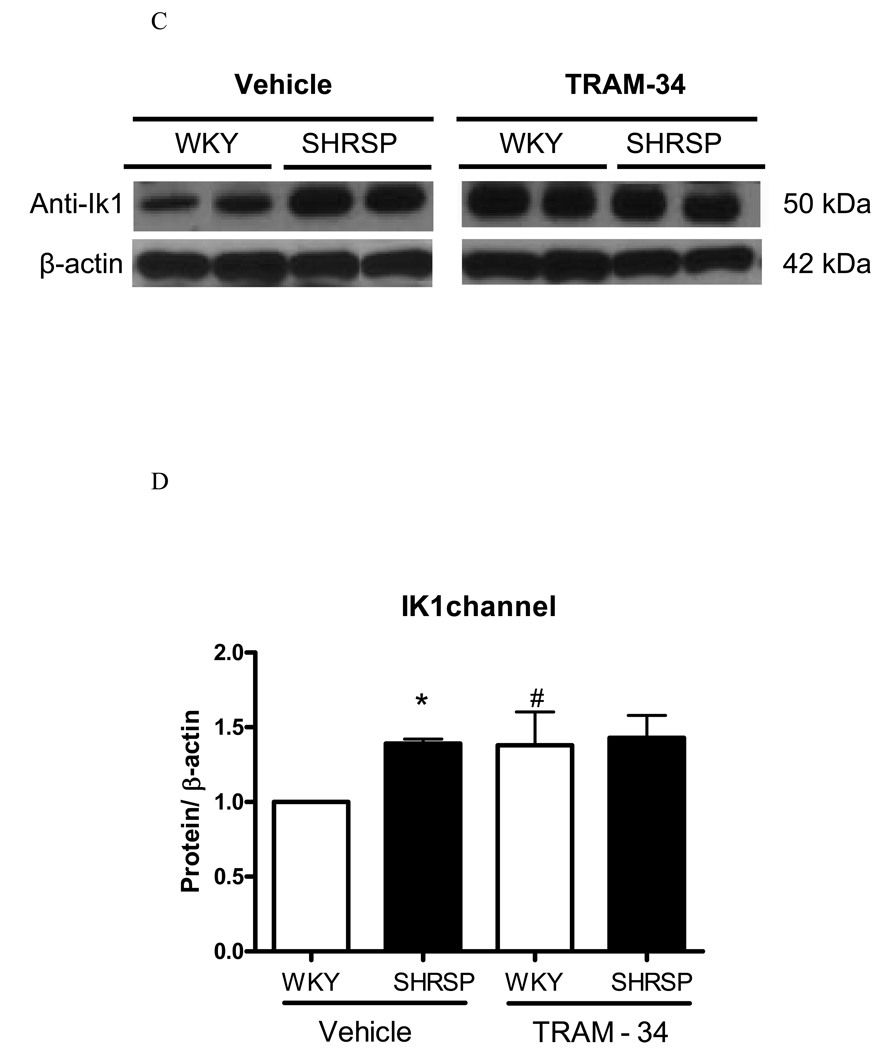
Figure 8. REST expression in mesenteric arteries from SHRSP and WKY.
(A) Representative immunoblots for REST, and β-actin expression in WKY and SHRSP mesenteric arteries, after vehicle or TRAM-34 (10µM, 24 hours) incubation and (B) corresponding bar graphs demonstrating REST expression. (C) Representative immunoblots for IK1 and β-actin expression in WKY and SHRSP mesenteric arteries, after vehicle or TRAM-34 (10µM, 24 hours) incubation and (D) corresponding bar graphs demonstrating IK1 expression. Values, expressed in arbitrary units, are mean ± SEM of n=5 experiments and were normalized by β-actin protein expression. * P<0.05 vs. WKY, # P<0.05 vs. vehicle SHRSP.


