
Figure 2. Characterization of the domains of interaction.
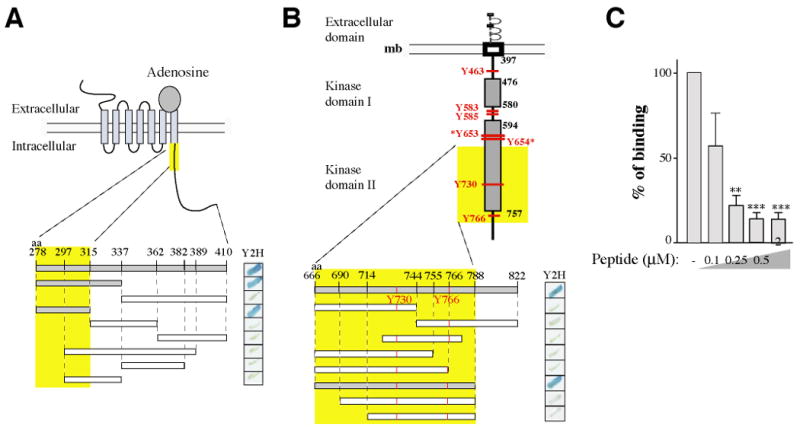
(A) Schematic representation of the A2A receptor. Various truncated GAL4-A2AR fusion proteins were expressed as bait in S. cerevisiae and tested in a yeast two-hybrid -galactosidase assay for their capacity to interact with the GAL4-FGFR prey (aa 666-822). (B) Schematic representation of the FGF receptor. Tyrosine phosphorylation sites are indicated in red. Various truncated GAL4-FGFR fusion proteins were expressed as prey in S. cerevisiae and tested for their capacity to interact with the GAL4-A2AR bait (aa 278-410).
In (A) and (B), positive interactions are indicated by the blue stain (right panels). Interacting fragments are indicated in grey and the minimal domain of interaction found is highlighted by the yellow boxes.
(C) Competition of the A2AR/FGFR interaction analyzed by GST pull-down with a synthetic peptide corresponding to the A2AR minimal domain of interaction (aa 278-315). Immobilized GST-A2AR-278-410 fusion protein was incubated with radio labeled in-vitro translated FGFR. Bound material was subjected to SDS-PAGE and visualized by autoradiography. Signals were quantified and statistical analysis performed as described in Methods.