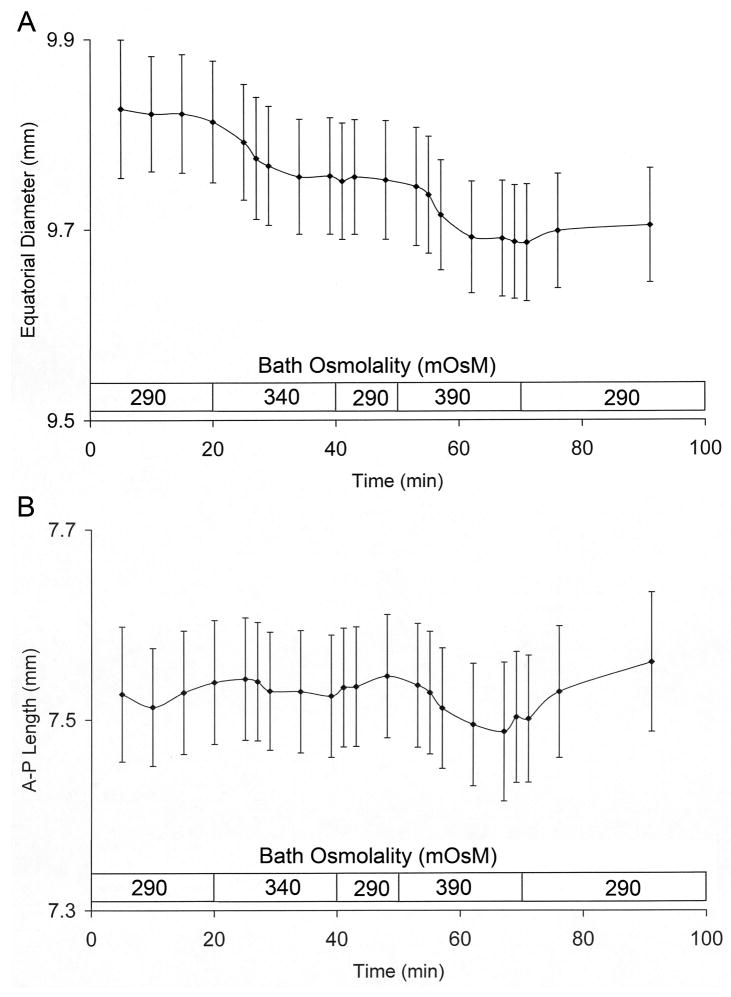
Fig. 2.
Time course of the changes in ED (panel A) and A-P length (panel B) upon initially introducing hypertonic media. A plot of the data from the lenses in Table 1. The tonicity shifts were accomplished by a total replacement of the lens bathing solutions with fresh media having a modified osmolality as indicated. During this replacement, which typically took about 3–5 min, the running time clock for the experiment was suspended and restarted as soon as the lens was covered with the fresh replacement solution. As such, the x-axis indicates the time of incubation in each osmolality.

