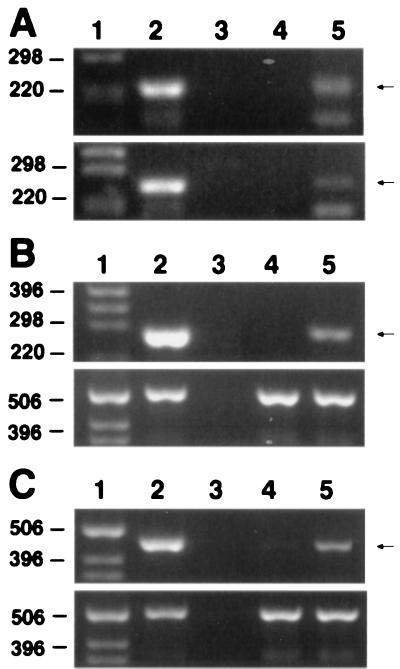
Figure 3.
PCR and RT-PCR analysis of the integration and induction of the antisense transcripts. In A–C, lane 1 represents the size markers, lane 2 the positive PCR control (a plasmid containing the sequence of interest), and lane 3 the negative control (water). The expected PCR products are indicated (Right). (A) PCR of genomic DNA for detection of the integrated retrovirus constructs. Upper shows the integrated antisense vector; Lower shows the integrated control vector. Lane 4, uninfected cell DNA; lane 5, DNA from retrovirus infected cells. (B and C Lower) GAPDH RT-PCR normalization controls. (B) Expression of the control vector transcript was detected by RT-PCR of total RNA from RT5 cells. Lane 4, tet added (gene suppression); lane 5, tet withdrawal (gene induction). (C) Expression of antisense RNA was detected by RT-PCR of total RNA from A4 cells. Lane 4, tet added (gene suppression); lane 5, tet withdrawal (gene induction).

