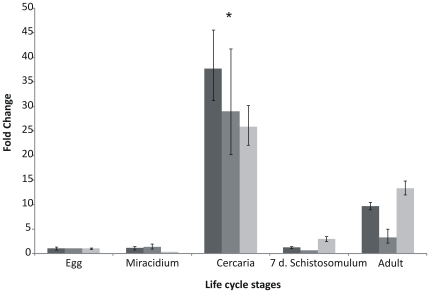
Figure 3. Relative expression levels of SmTNFR among five S. mansoni life cycle stages.
The different bar colors indicate three independent biological replicas. The expression levels of egg stage were arbitrarily set as 1, and values for other stages are represented as fold changes relative to this value, within the corresponding biological replica. Bars represent standard deviation of the mean for three technical replicates within each biological replica. Tubulin was used as internal normalization gene. ANOVA was used for calculating the statistical significance of expression changes among all life cycle stages (p-value <0.0001). Tukey test was used to calculate the significance between two life cycle stages. * p-value <0.01 between cercaria and egg, cercaria and miracidium, cercaria and schistosomulum and cercaria and adult comparisons.

