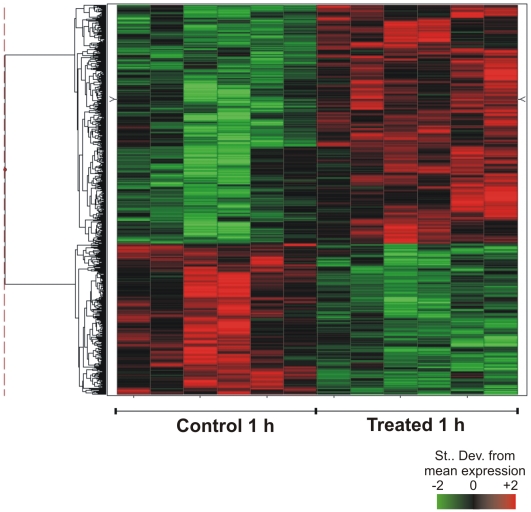
Figure 5. Effect of human TNF-α on gene expression profile in 3-h old early schistosomula.
Schistosomula were treated for 1 h with 20 ng/ml human TNF-α just 3 h after in vitro mechanical transformation of cercariae. Microarrays were used for large-scale gene expression measurements, and the figure shows a hierarchical clustering of the 548 genes that exhibited significant (q-value ≤0.05) changes in their expression levels, in relation to control non-treated 3-h old early schistosomula. Each horizontal line represents a gene; each column represents one experimental replica. There are two technical replicates for each of three biological replicates. For each gene, color intensity is proportional to the number of standard derivations from the mean expression for that gene, as indicated in the scale bar, and shows genes that were induced (red) or repressed (green) by treatment.

