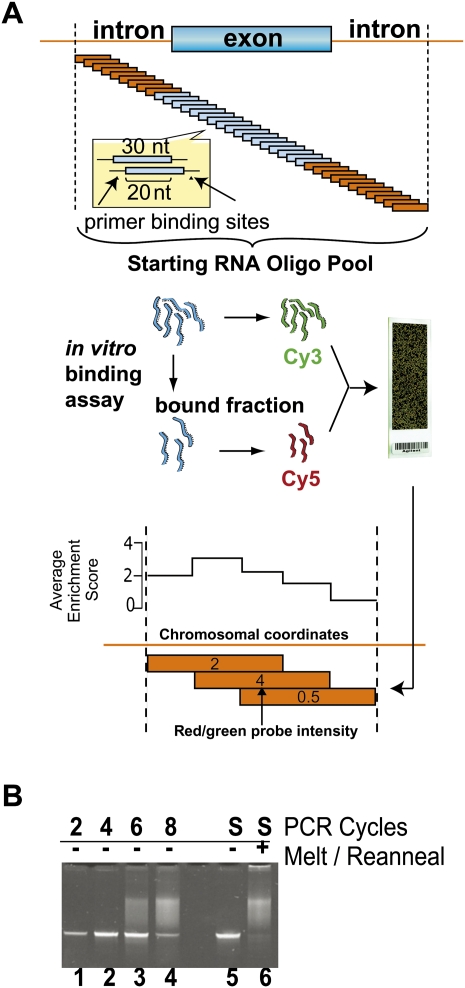
FIGURE 1.
Experimental scheme for mapping splicing factors to pre-mRNA. (A) The oligonucleotide pool was designed by tiling a length of 30 oligonucleotides in 10-nt increments across approximately 4000 genomic regions. A total of 241,347 experimental and 90 validation sequences were flanked by common primers and ordered as features on a custom microarray. Features were recovered from the array surface by scouring (Materials and Methods) and PCR-amplified using the common, T7-promoter-tailed primers. After T7 transcription, the amplified pool was partitioned into bound and unbound fractions by EMSA with U1snRNP preparations (see Fig. 2) or by co-immunoprecipitation from HeLa nuclear extract using αPTB mab BB7 (Fig. 3). Next, the starting pool was internally labeled with Cy3 dye, and the bound fraction was labeled with Cy5. These two RNA pools were mixed so oligonucleotides competed for binding on a two-color microarray, resulting in enrichment data. The array data were mapped to genomic coordinates, and the scores at each location were averaged and converted to base-10 log. An illustration of this averaging step is given for three theoretical overlapping 30-nt oligonucleotides with scores of 2, 4, and 0.5, where the average enrichment score for each 10-nt window is graphed above. (B) Pool overamplification was checked by electrophoresis. Acrylamide gel lanes 1–4 represent the PCR-amplified pool after an additional two, four, six, and eight cycles of PCR beyond the optimal amplification. Heteroduplexes composed of unextended template are presumed to comprise the low mobiliy smear in lanes 3 and 4. The optimally amplified starting material (S, lane 5) was melted and reannealed creating a mixed population of heteroduplexes that migrates as a similar low mobility smear (lane 6).

