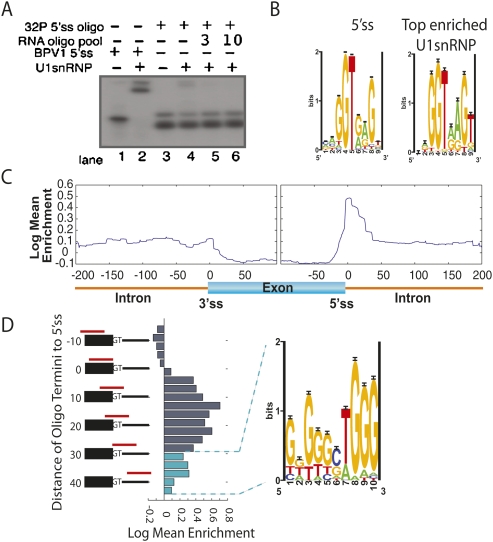
FIGURE 2.
Annotating pre-mRNA with locations of U1snRNP binding. (A) The parameters of U1snRNP gel shift were established with radiolabeled BPV 5′ss positive control (lane 2) and radiolabeled RNA oligonucleotide pool to achieve a 1:20 shifted-to-unshifted ratio of labeled RNA oligonucleotide pool (cf. lane 3 and lane 4). An additional 3 μg and 10 μg of cold RNA oligonucleotide pool established that the probe was in excess (lanes 5,6). (B) Oligonucleotides were ranked according to their ability to bind U1snRNP. (Left panel) The motif returned from Gibbs sampling on the 5′ss; (right panel) the motif returned from the top 100 U1snRNP enriched oligonucleotides. (C) A generalized RNA map for U1snRNP enrichment data was made by compiling the information from all ∼4000 regions into one map. The enrichment scores for each oligonucleotide were sorted based on their distance from splice sites (x-axis). An average enrichment score (y-axis) was calculated for each position 200 bases into the intron and 100 bases into the exon from each splice site and plotted, resulting in a single map encompassing the entire enrichment data set. (D) Oligonucleotide enrichment in the U1snRNP fraction was compared to the 5′ss location. The registry of the 5′ss with respect the 3′-end of the oligonucleotide (red bars in alignment) is listed on the vertical axis. Enrichment was plotted as a histogram. Oligonucleotides used to calculate cyan histogram bars were selected for motif finding analysis.

