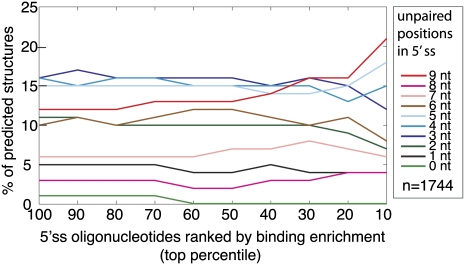
FIGURE 3.
Comparison of secondary structure with U1snRNP binding. Secondary structure was modeled using Sfold for each of the 1744 oligonucleotides that contained an annotated 5′ splice site (Ding et al. 2005). The structures are classified according to the degree of predicted base-pairing over the windows that encompass the 9-nt 5′ss. The y-axis plots the average number of predicted structures in each category for the particular bin of oligonucleotides defined by the x-axis. The x-axis defines the bins as top cumulative percentile ranks where oligonucleotides are ranked according to their enrichment in the U1snRNP shifted fraction.

