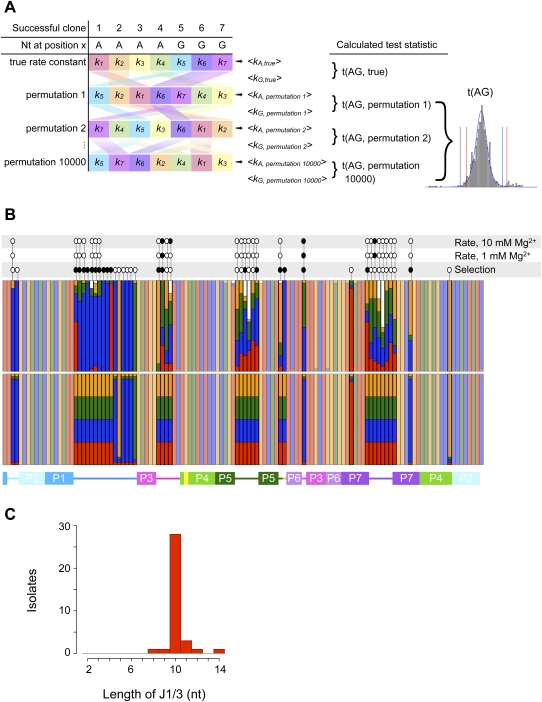
FIGURE 3.
(A) Outline of Monte Carlo analysis of the kinetic effects of different nucleotides at each position in the ribozyme. At each position subjected to analysis, the pairings of nucleotide identity and rate constant were shuffled randomly 10,000 times, and the mean rate constants newly associated with each nucleotide were calculated. The t-statistic describing the difference in mean rate constants of ribozymes bearing, e.g., A and G residues was calculated for each permutation, revealing the underlying t-distribution and the critical values to which the true t-statistic was compared. Note that, whereas the canonical t-distribution (blue curve) has symmetric tails and thus symmetric critical values (blue vertical lines), the Monte Carlo simulation (gray bars) can reveal a t-distribution with markedly asymmetric tails and critical values (red lines). (B) Observed (top) and expected (bottom) nucleotide frequencies in the ligase selection. Red, G; blue, A; green, U; orange, C; white, gap. Less-saturated colors mark positions that were not deliberately varied in the pool. Above the colored bars are the results of Monte Carlo analyses of nucleotide identity effects on ribozyme kinetics at the indicated Mg2+ concentrations and of Fisher's exact test to detect significant deviation of observed from expected nucleotide frequencies. Open ovals indicate that a test was performed but revealed no significant effect; filled ovals indicate significant effects. The secondary-structure schematic below is colored as in Figure 1. (C) Histogram of the observed lengths of J1/3 sequences among successful ligase variants. J1/3 was varied from 2 to 10 nt in the starting pool; how some variants acquired longer J1/3 sequences is unknown.

