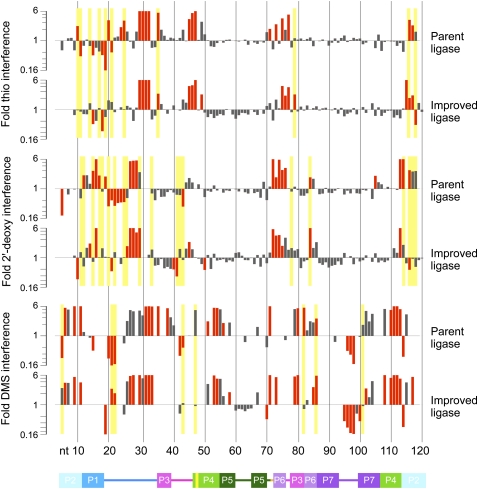
FIGURE 6.
Log-scale maps of mean phosphorothioate (thio), 2′-deoxy, and DMS interference and enhancement effects in the parent and improved ligases. Positions of significant (95% confidence interval excludes 1.0) and strong (mean greater than or equal to twofold) effects are shown in red. Yellow bars highlight positions at which the mean fold effect differs both significantly (P < 0.05, t-test) and substantially (by a factor of ≥2) between the two ribozymes. Phosphorothioate interferences obscure possible 2′-deoxy effects at several positions in both ligases. DMS mapping by primer extension yields data only for A and C residues. Ribozyme positions are numbered below, with the secondary structure cartoon colored as in Figure 1.

