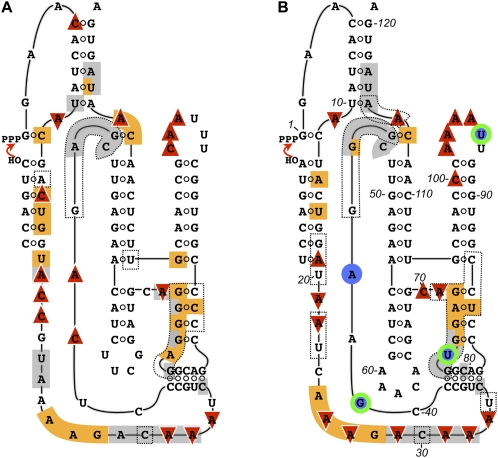
FIGURE 7.
Secondary-structure projections of the (A) parent and (B) improved class I ligase ribozymes, superimposed with the results of structural and sequence mapping. Dotted lines in A indicate the parent residues at which the C4′ atom was protected from Fe-EDTA-generated hydroxyl radicals (Bergman et al. 2004). Dotted lines in B indicate sites at which the C4′ atom was calculated to be solvent inaccessible in the crystal structure (Shechner et al. 2009). Phosphorothioate interference is shown in gray; 2′-deoxy interference is shown in orange; DMS interference is shown by downward-pointing red triangles, and DMS enhancement by upward triangles. In B, positions at which the Monte Carlo analysis revealed a significant association between nucleotide identity and activity are highlighted by blue circles if the effect appeared at 10 mM Mg2+ and by green and blue rings if the effect appeared at both 10 mM and 1 mM Mg2+.

