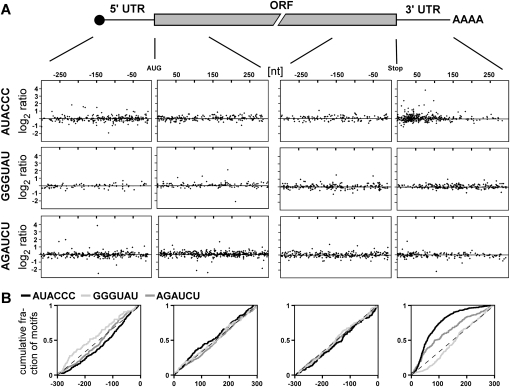
FIGURE 4.
Positional analysis of AUACCC. (A) Upper part, schematic representation of an eukaryotic mRNA consisting of 5′ CAP structure (black circle), 5′ UTR, ORF, 3′ UTR, and poly(A) tail (AAAA). Lower part, positions of AUACCC, GGGUAU, and AGAUCU (first, second, and third row, respectively) are plotted against the log2 ratio of the lower bound of fold change of the respective transcripts obtained in microarray analysis comparing FB2khd4Δ versus FB2. The four windows in each row depict 300 nt of 5′ and 3′ UTR as well as the first and last 300 nt of the ORF (indicated by lines). Positions are given relative to the start or stop codon in case of 5′ UTR and the first 300 nt of ORF or the last 300 nt of ORF and 3′ UTR, respectively. (B) Graph depicting the cumulative distribution of AUACCC (black), GGGUAU (light gray), and AGAUCU (medium gray) in the four transcript regions as defined in A. The cumulative fraction of motifs is plotted along the 300 nt of each region.

