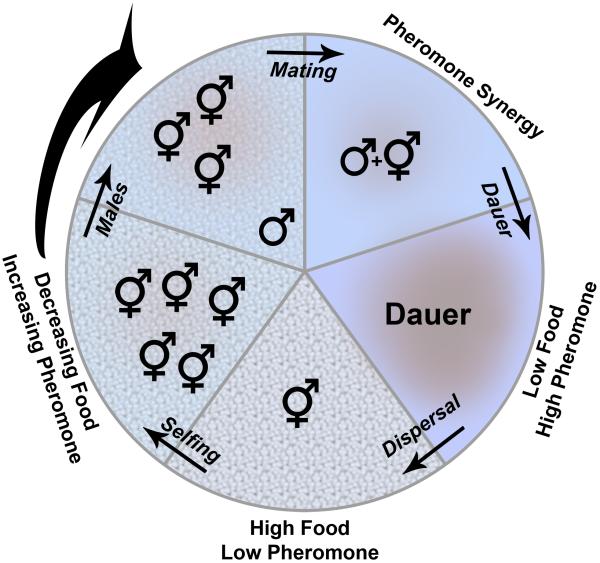
Figure 2. General model for C. elegans ascaroside pheromone function.
Starting with the bottom wedge in the circle that represents a microenvironment with high food and low pheromone, food levels decrease and pheromone increases going clockwise around the circle. Food is represented by the pattern on the surface and the colors represent pheromone. Discussion and overall rationale for each stage is given in the text.

