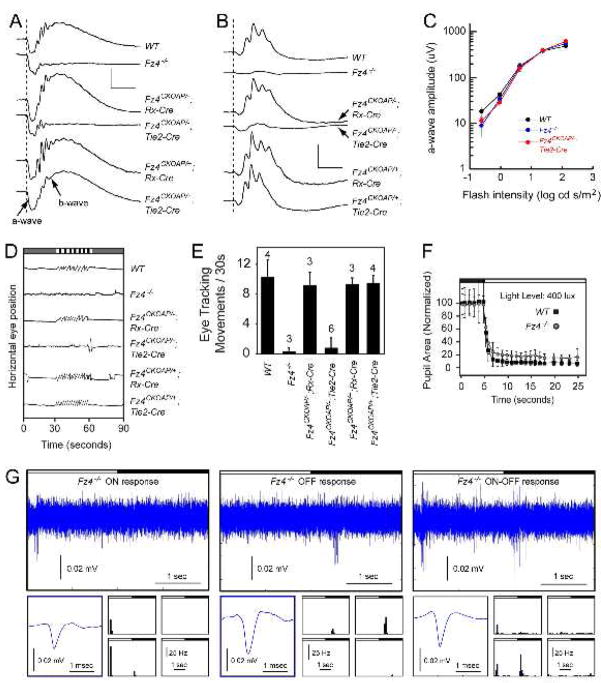
Figure 2.
Deficits in visual function associated with retinal vascular insufficiency
(A) Rod ERG responses to a strobe flash (dashed line) presented in darkness. Scale bars, 500 uV and 50 ms.
(B) Cone ERG responses to a strobe flash (dashed line) superimposed upon a steady rod-desensitizing adapting field. Scale bars, 200 uV and 50 ms.
(C) Amplitude of the dark-adapted a-wave measured 8 ms after the flash, as a function of stimulus intensity. There is no statistically significant difference between control a-waves (averages of Fz4+/+, Fz4+/−, Fz4CKOAP/+;Rx-Cre, and Fz4CKOAP/+;Tie2-Cre) and Fz4−/− and Fz4CKOAP/−;Tie2-Cre a-waves. The number of mice tested were: Fz4+/+ (2), Fz4+/− (4), Fz4CKOAP/+;Rx-Cre (6), Fz4CKOAP/+;Tie2-Cre mice (5), Fz4−/− (7), Fz4CKOAP/−;Rx-Cre (6), and Fz4CKOAP/−;Tie2-Cre (6). Bars, SD.
(D) The OKR to horizontally rotating vertical stripes (striped bar at top) is lost in Fz4−/− and Fz4CKOAP/−;Tie2-Cre mice.
(E) Quantification of the OKR. The number of mice tested is indicated. Among six Fz4CKOAP/−;Tie2-Cre tested, one showed a weak OKR and was subsequently found to exhibit incomplete Cre-mediated recombination in the retinal vasculature; the remaining five mice showed no OKR. Bars, SD.
(F) Fz4−/− and WT littermates show nearly normal pupil constriction following the onset of a 400 lux stimulus (open bar at top). For each genotype, four mice were tested six times and the 24 responses averaged. Bars, SD.
(G) Extracellular multi-electrode array recordings of light responses from ganglion cell layer neurons from two month old Fz4−/− retinas. Upper panels, individual ON, OFF, and ON-OFF cell responses to two seconds of light followed by two seconds of darkness (black and white bars). Shown for each cell is the averaged spike waveform obtained from ten repetitions of the alternating light/dark stimulus (lower left panels) and a peri-stimulus histogram showing the frequency (Hz) and timing of spikes in response to ten repetitions of the stimulus at each of four stimulus locations comprising a 2×2 subset of the 5×5 stimulus array (lower panels; 100 msec bins).

