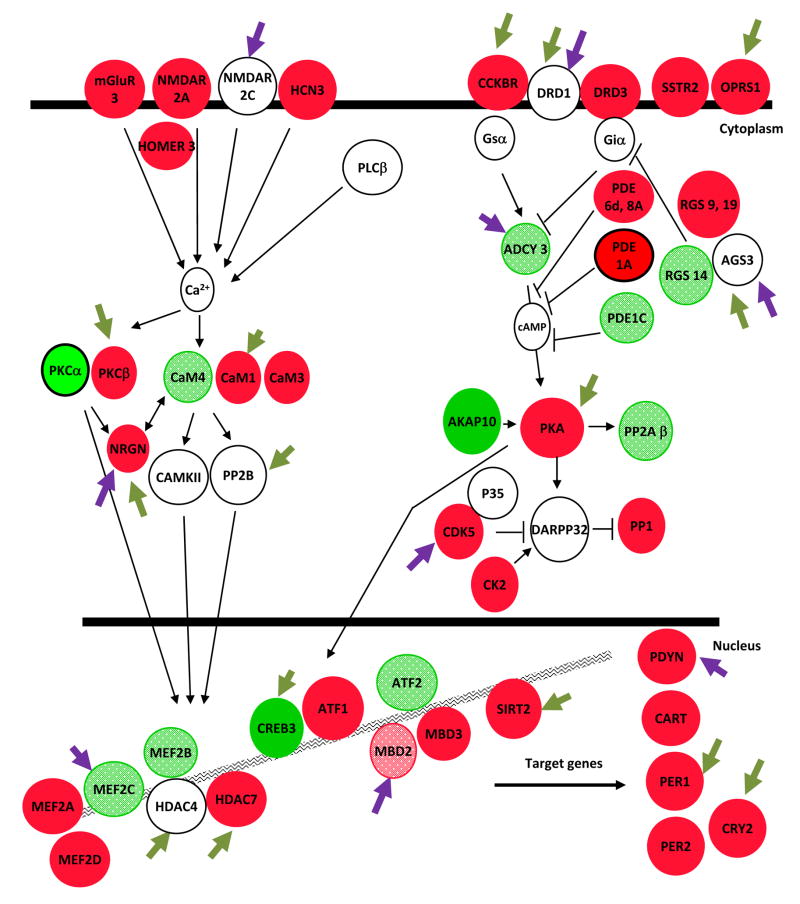
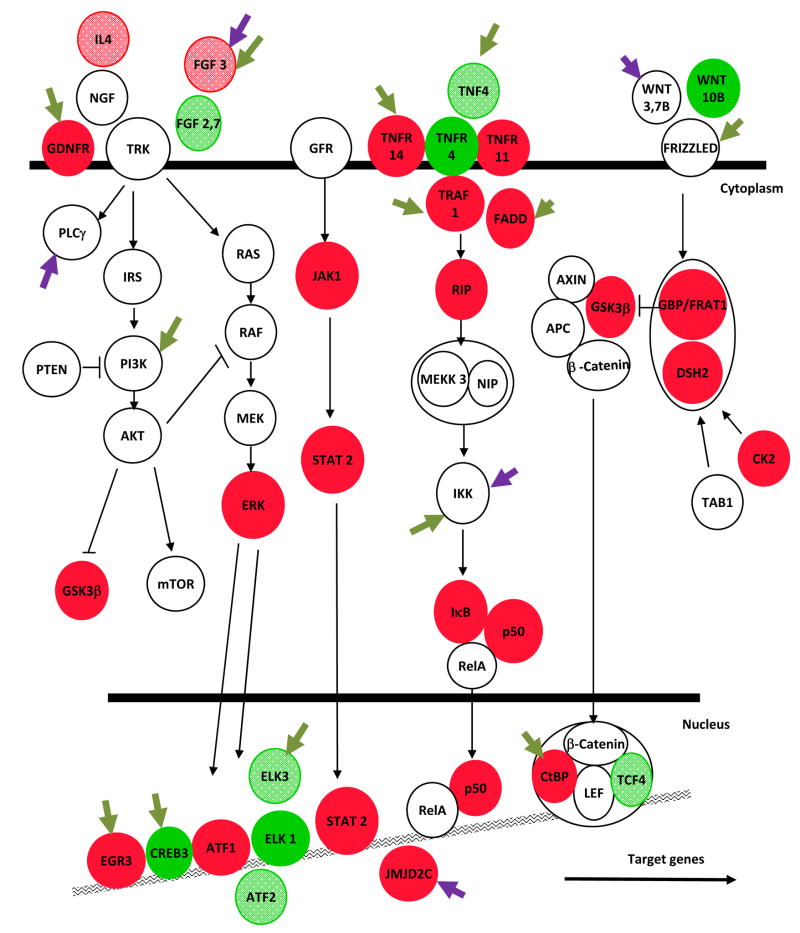
Fig. 6. Molecular pathway analysis of the genomic effects of cocaine in the NAc.
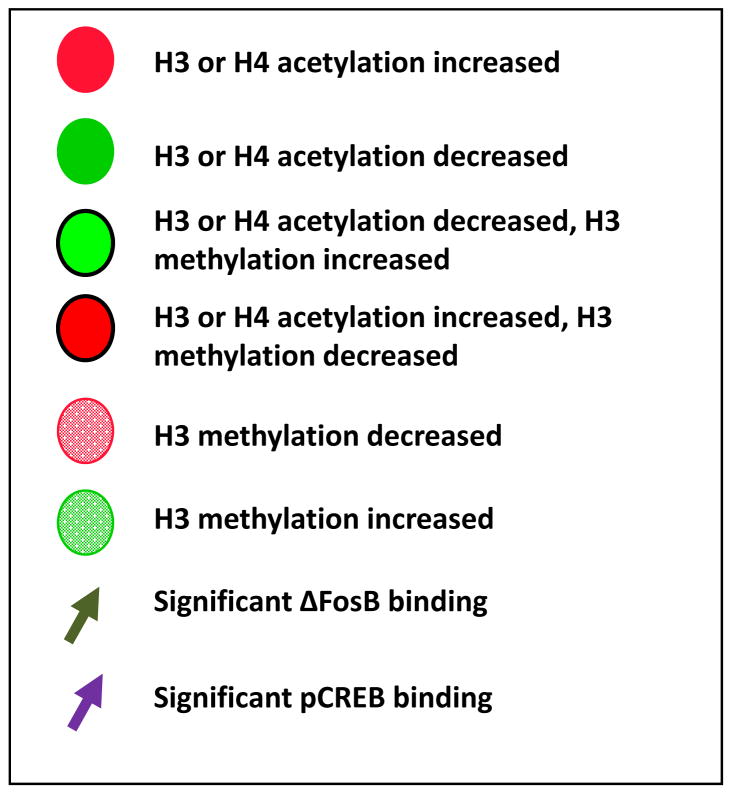
Chronic cocaine-induced molecular changes in the NAc were identified by ChIP-chip for changes in acetylated H3 and H4, H3 dimethyl-K9/K27, ΔFosB, and phospho-CREB binding followed by rigorous statistical analysis (>3.1SD) and Ingenuity molecular pathway examination. The Key defines the different types of regulation shown in the figure. Alterations in second messenger (A) and growth factor (B) regulated pathways are shown. Red indicates modifications associated with gene activation (increased histone acetylation or decreased methylation); bright green, gene repression (decreased histone acetylation or increased methylation). Dark green arrows indicate genes that show significant alterations in ΔFosB binding, purple arrows phospho-CREB binding. See Supplemental Information for definitions of the gene abbreviations used in the figure.


