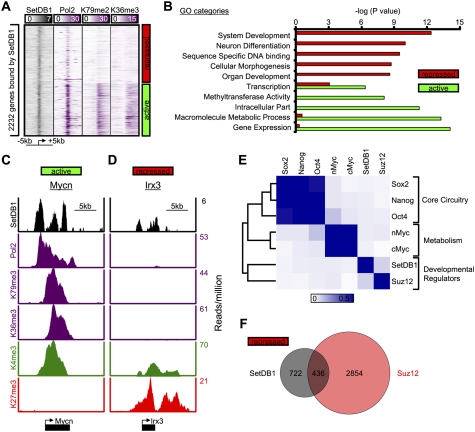
Figure 2.
SetDB1 occupies genes encoding developmental regulators in mES cells. (A) Binding density of regions surrounding the transcriptional start site (±5 kb) of 2232 genes bound by SetDB1. Genes were classified as active if they were enriched for RNA polymerase II, H3K79me2, and H3K36me3, and repressed if they lacked such evidence. (B) Gene Ontology (GO) analysis of genes occupied by SetDB1 that were categorized as active or repressed in mES cells. (C,D) SetDB1, RNA polymerase II, and histone H3K79me2, H3K36me3, H3K4me3, and H3K27me3 modification profiles for an actively transcribed gene (Mycn), an oncogene, and a repressed gene (Irx3), a homeodomain-containing transcription factor that is involved in spatially prepatterning the neural system. (E) Heat map showing colocalization frequency of SetDB1 and PRC subunit Suz12, together with other key ES cell transcriptional regulators. Colors in the heat map reflect the colocalization frequency of each pair of regulators (blue means more frequently colocalized). Regulators were clustered along both axes based on the similarity in their colocalization with other regulators. (F) Venn diagram representation of repressed genes occupied by SetDB1 and Suz12.

