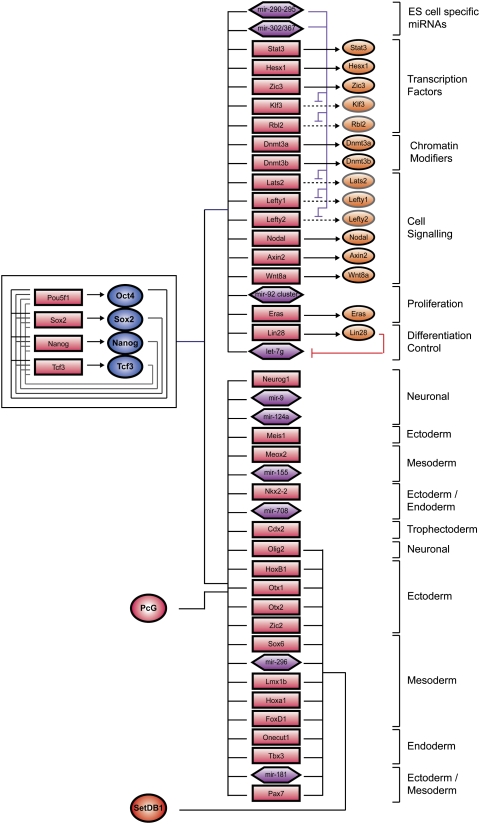
Figure 4.
Model for transcriptional regulation by SetDB1. A model of core ES cell regulatory circuitry is shown with a subset of genes occupied by the transcription factors and chromatin regulators depicted in the diagram. The interconnected autoregulatory loop is shown to the left. Active genes are shown at the top right, and inactive genes are shown at the bottom right. Transcription factors are represented by dark-blue circles, and PcG complexes and SetDB1 are indicated by a red circle. Gene promoters are represented by red rectangles, gene products are indicated by orange circles, and miRNA promoters are represented by purple hexagons.

