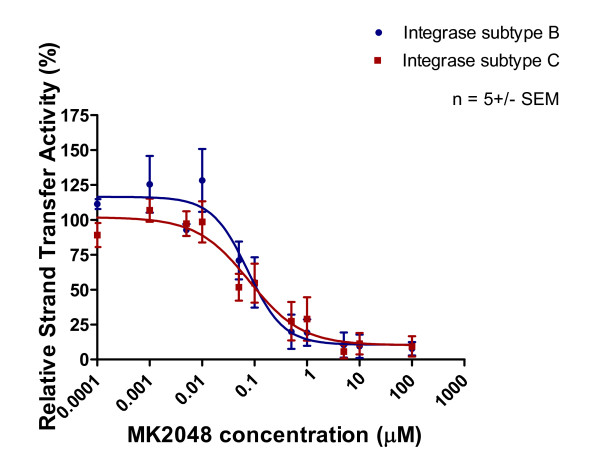
Figure 10.
Inhibition of strand transfer as a function of increasing MK-2048 concentration. Subtype B and C strand transfer activity (presented as relative percentage) in relation to increasing MK-2048 concentration. This graph was prepared with GraphPad Prism 4.0, the combined result of quantification and analyses of at least 3 independent experiments.

