
Figure 1.
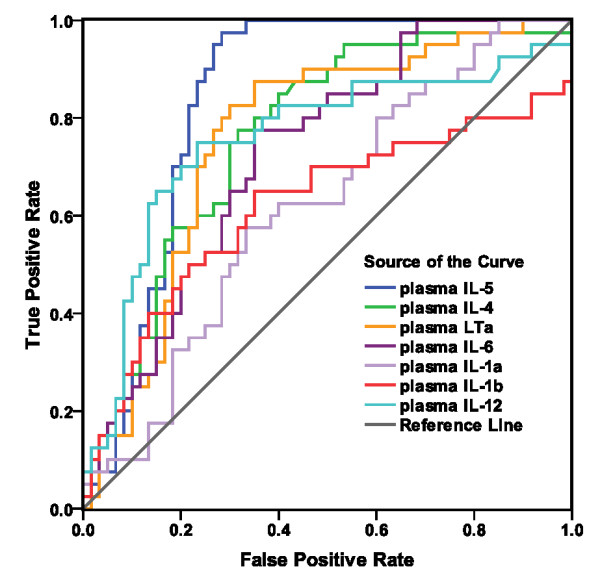
ROC curves shows the classification performance of plasma cytokines from CFS cases and healthy controls. Curves are for the 7 cytokines significantly elevated (p < .05) in cases compared to controls (IL-4, IL-5, IL-12, LTα, IL-1α, IL-1β, and IL-6).