
Figure 2.
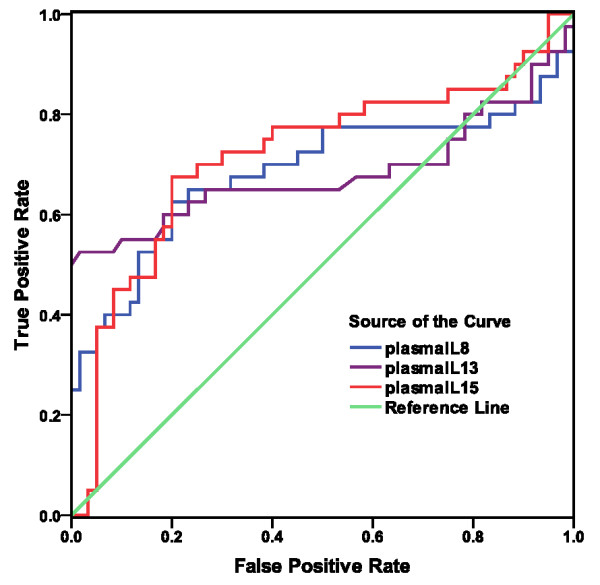
ROC curves show the classification performance of plasma cytokines from CFS cases and healthy controls. Curves are for the 3 cytokines significantly lower (p < .05) in cases compared to controls (IL-8, IL-13 and IL-15).
Official websites use .gov
A
.gov website belongs to an official
government organization in the United States.
Secure .gov websites use HTTPS
A lock (
) or https:// means you've safely
connected to the .gov website. Share sensitive
information only on official, secure websites.
ROC curves show the classification performance of plasma cytokines from CFS cases and healthy controls. Curves are for the 3 cytokines significantly lower (p < .05) in cases compared to controls (IL-8, IL-13 and IL-15).