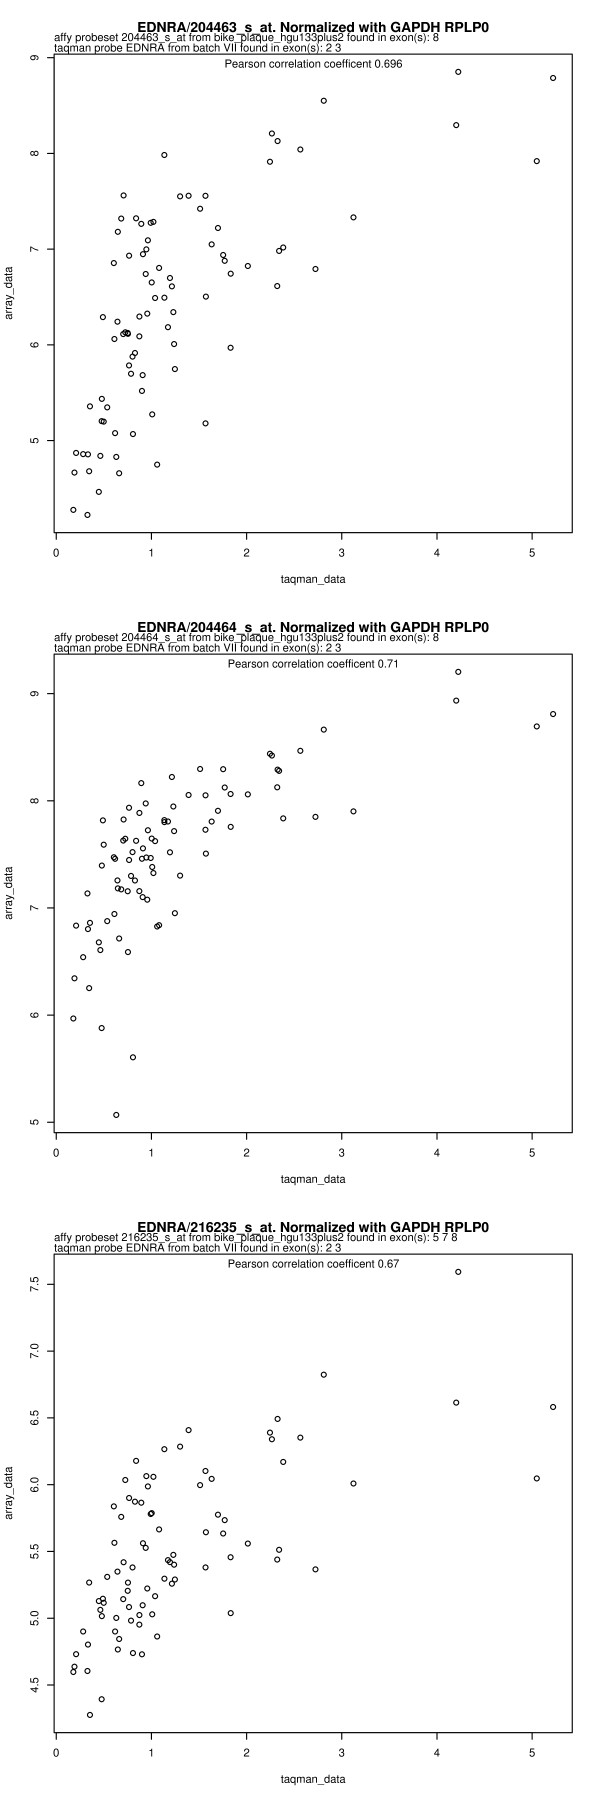
Figure 1.
Correlation between real-time PCR data and microarray data for EDNRA. Real-time PCR data has been analyzed using the ΔΔCt method with GAPDH and RPLP0 as endogenous controls. Microarray data are shown for each of the three probe sets in EDNRA. The values were obtained using the Affymetrix Power Tools implementation of RMA normalization [8]. Exon location information for TaqMan probes is from the Applied Biosystems webpage. Exon location for microarray probe sets was obtained as described in methods.

